![In [5] df.shape Out[5](1972, 8) In [6]:df.columns Out [ 6] Index([ Category, currency, sellerRating, Duration, OpenPr](http://img.homeworklib.com/images/ac4c1c82-113f-45e7-af19-40584386a03a.png?x-oss-process=image/resize,w_560)
![4 ] Category currency sellerRating Duration endDay ClosePrice OpenPrice Competitive? 0 Music/Movie/Game US Mon 0.01 3249 5 0.](http://img.homeworklib.com/images/ebfe8ae4-e540-41b7-9b49-7cd9326109c5.png?x-oss-process=image/resize,w_560)
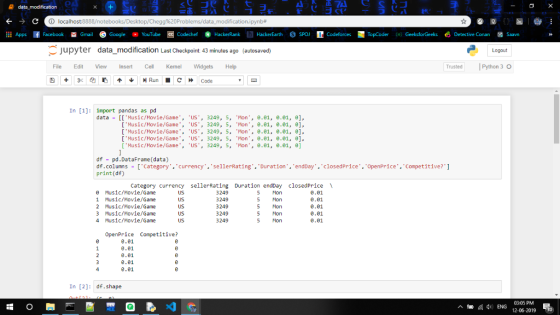
python.
the dataset is a big excel file with 1972 rows and 8 columns.
i need the lines of code that does the following.
-Rearrange columns to look like this: 'Category', 'currency', 'endDay', 'sellerRating', 'Duration', 'OpenPrice', 'ClosePrice', 'Competetive'
-Create dummies for 'Category', 'currency', and 'endDay' columns
-Normalize all the numeric columns (Competetive is not numeric, it is categorical). Your final dataset should contain all the dummies as well as normalized numeric values plus 'Competetive?' column (33 columns).
4 ] Category currency sellerRating Duration endDay ClosePrice OpenPrice Competitive? 0 Music/Movie/Game US Mon 0.01 3249 5 0.01 Music/Movie/Game US 3249 5 Mon 0.01 0.01 2 Music/Movie/Game US 3249 Mon 0.01 0.01 5 3 Music/Movie/Game US 3249 Mon 0.01 5 0.01 4 Music/Movie/Game US 3249 5 Mon 0.01 0.01 O O O o o LO LO
Homework Answers
NOTE: I Hope the below solution meets your requirements as per the Question. Please Do UPVOTE if it Does. :)
The solution is performed on the basis of sample data shown in the question.
According to question , total_columns(15) = actual_columns(8) + dummy_columns(3) + normalised_columns(4)
In order to increase to columns you can just add the column names in the cell where it has to be modified.
## Python Code of the Cells
#!/usr/bin/env python
# coding: utf-8
# In[1]:
import pandas as pd
data = [['Music/Movie/Game', 'US', 3249, 5, 'Mon', 0.01, 0.01,
0],
['Music/Movie/Game', 'US', 3249, 5, 'Mon', 0.01, 0.01, 0],
['Music/Movie/Game', 'US', 3249, 5, 'Mon', 0.01, 0.01, 0],
['Music/Movie/Game', 'US', 3249, 5, 'Mon', 0.01, 0.01, 0],
['Music/Movie/Game', 'US', 3249, 5, 'Mon', 0.01, 0.01, 0]
]
df = pd.DataFrame(data)
df.columns =
['Category','currency','sellerRating','Duration','endDay','closedPrice','OpenPrice','Competitive?']
print(df)
# In[2]:
df.shape
# In[3]:
df.columns
# In[4]:
df.dtypes
# In[5]:
df
# In[6]:
df =
df.reindex(['Category','currency','endDay','sellerRating','Duration','OpenPrice','closedPrice','Competitive?'],
axis = 1)
df
# In[7]:
df =
pd.concat([df,pd.get_dummies(df[['Category','currency','endDay']])],
axis = 1)
df
# In[8]:
df['Normalised_sellerRating'] =
df['sellerRating']/df['sellerRating'].max()
df['Normalised_Duration'] =
df['Duration']/df['Duration'].max()
df['Normalised_OpenPrice'] =
df['OpenPrice']/df['OpenPrice'].max()
df['Normalised_closedPrice'] =
df['closedPrice']/df['closedPrice'].max()
df
# In[9]:
df.shape
## Screenshots of the Cells in Jupyter notebook:


Add Answer to:
python. the dataset is a big excel file with 1972 rows and 8 columns. i need...
Most questions answered within 3 hours.
-
Where is the error in this code sequence?
String s1 = "Hello";
String s2 = "ello";...
asked 10 months ago -
Financial data for Joel de Paris, Inc., for last year
follow:
Joel de Paris, Inc.
Balance...
asked 10 months ago -
Consider this reaction:
Al2(SO4)3 (aq)+ BaCl3
(aq) Al2Cl6 (aq)- +
3BaSO4(s) . What is the...
asked 10 months ago -
Suppose that Savneet is considering increasing her
recent random sample from 20 car rentals to 40...
asked 10 months ago -
Trucks arrive at an unloading terminal at an average rate of 120
per hour.
Trucks arrive...
asked 10 months ago -
Why are methanol and ethanol completely soluble in water while
octanol is not very little soluble....
asked 10 months ago -
A facilities manager at a university reads in a research report
that the mean amount of...
asked 10 months ago -
When the CuSO4 is rehydrated by adding water to the anhydrous
compound, is this an endothermic...
asked 10 months ago -
A ray of sunlight is passing from diamond into crown glass; the
angle of incidence is...
asked 10 months ago -
A block of mass 0.249 kg is placed on top of a light, vertical
spring of...
asked 10 months ago -
how do the kidneys compensate in the presences of acidosis
a) trigger hyperventilate
b) reserve acid...
asked 10 months ago -
Question 501 pts
The rental rate of capital to the firm increases. Which of the
following...
asked 10 months ago