


Consider the following scenario: Your boss has come to you for advice on the current finances of the company and needs you to create an extended DuPont analysis, common size analysis, and percentage change analysis. Your boss wants you to fill out the attached Excel file because he/she has no idea what she is talking about and is going to use your report as her work. Remember to answer all the questions in the attached document. Has J&W's liquidity position improved or worsened? Explain Has J&W's ability to manage its assets improved or worsened? Explain How has J&W's profitability changed during the last year? Perform an extended DuPont analysis for J7W for 2015 and 2016. What do these results tell you? Perform a common size analysis. What has happened to the composition (That is, the percentage in each category) of assets and liabilities? Perform a percentage change analysis. What does this tell you about the change in profitability and asset utilization?
***Section 'F' is the only section I need.
Homework Answers
Percentage Change Balance Sheet
| Assets | 2016 | 2015 | Dollar Change | Percentage Change |
| Cash and Cash Equivalents | $21000 | $20000 | + $1000 | + 5% |
| Short Term Investments | 3759 | 3240 | + 519 | + 16.02 % |
| Accounts Receivable | 52500 | 48000 | + 4500 | +9.37 % |
| Inventories | 84000 | 56000 | + 28000 | + 5% |
| Total Current Assets | $161259 | $127240 | + 34019 | + 26.74% |
| Net Fixed Assets | 218400 | 200000 | + 18400 | + 9.2% |
| Total Assets | $379659 | $327240 | + 52419 | +16.02% |
| Liabilities and equity | ||||
| Accounts payable | $33600 | $32000 | + $1600 | + 5 % |
| Accruals | 12600 | 12000 | + 600 | + 5% |
| Notes payable | 19929 | 6480 | + 13449 | + 207.55% |
| Total Current Liabilities | $66,129 | $50,480 | + 15649 | + 31% |
| Long-term debt | 67,662 | 58,320 | + 9342 | +16% |
| Total Liabilities | $1,33,791 | $1,08,800 | +24991 | + 22.97% |
| Common stock | 1,83,793 | 1,78,440 | + 5353 | + 3% |
| Retained earnings | 62,075 | 40,000 | + 22075 | +55.19% |
| Total Common equity | $2,45,868 | $2,18,440 | + 27,428 | +12.56% |
| Total Liabilities and equity | $379,659 | $3,27,240 | + 52,419 | +16.02% |
| Percentage Change Income Statement | 2016 | 2015 | Dollar Change | Percentage Change |
| Sales | $420,000 | $400,000 | + $20000 | +5% |
| COGS | 300,000 | 298,000 | + 2000 | +0.67% |
| Depreciation and Amortization | 19,660 | 18000 | +1660 | +9.22% |
| Other operating expenses | 27600 | 22000 | +5600 | +25.45% |
| EBIT | $72740 | $61,600 | +11,140 | +18.08% |
| Interest Expense | 5740 | 4460 | +1,280 | +28.70% |
| EBT | 67,000 | 57,540 | +9460 | +16.44% |
| Taxes | 26,800 | 23,016 | +3784 | +16.44% |
| Net Income | 40,200 | 34,524 | +5,676 | +16.44% |
The profit has increased by 16.44% and the total assets have increased by 16.02%.
Add Answer to:
Consider the following scenario: Your boss has come to you for advice on the current finances...
Consider the following scenario: Your boss has come to you for advice on the current finances...
 Consider the following
scenario: Your boss has come to you for advice on the current
finances of the company and needs you to create an extended DuPont
analysis, common size analysis, and percentage change analysis.
Your boss wants you to fill out the attached Excel file because
he/she has no idea what she is talking about and is going to use
your report as her work.
Remember to answer all the questions in the attached
document.
Has J&W's liquidity position...
Consider the following
scenario: Your boss has come to you for advice on the current
finances of the company and needs you to create an extended DuPont
analysis, common size analysis, and percentage change analysis.
Your boss wants you to fill out the attached Excel file because
he/she has no idea what she is talking about and is going to use
your report as her work.
Remember to answer all the questions in the attached
document.
Has J&W's liquidity position...
Your boss is back. This time he/she provides you a partial model to a bond valuation....
 Your boss is back. This time he/she provides you a partial model
to a bond valuation. This bond is a 20-year, 8% semiannual coupon
bond with a par value of $1,000 may be called in 5 years at a call
price of $1,040. The bond sells for $1,100. (Assume that the bond
has been issued.) She needs you to complete the partial model for
her. She needs the following to be answered.
What is the bond's yield to maturity?
What...
Your boss is back. This time he/she provides you a partial model
to a bond valuation. This bond is a 20-year, 8% semiannual coupon
bond with a par value of $1,000 may be called in 5 years at a call
price of $1,040. The bond sells for $1,100. (Assume that the bond
has been issued.) She needs you to complete the partial model for
her. She needs the following to be answered.
What is the bond's yield to maturity?
What...
Notes Based on year-end balance sheet figures. Calculation is based on a 365-day year. SPREADSHEET PROBLEM...
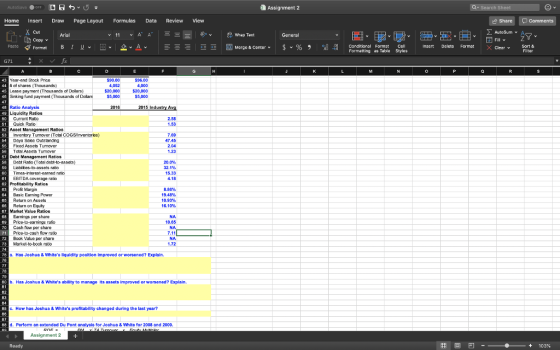
 Notes Based on year-end balance sheet figures. Calculation is based on a 365-day year. SPREADSHEET PROBLEM (3-15) Analysis Start with the partial model in the file Ch03 P15 Build a Model.XIS From the textDOORS Web site. Joshua & White (J&W) Technology's financial statements are also shown here. Answer the following questions. (Note: Industry average ratios are provided in Ch03 P15 Build a Model.xlsx.) a. Has J&W's liquidity position improved or worsened? Explain. b. Has J&W's ability to manage its assets...
My question is how to solve the answers for the yellow blocks? Is there any possible...
 My question is how to solve the answers for the yellow blocks?
Is there any possible way I could get some help with this
question.
AutoSave OFF Unit 2 Ratio Data Home Insert Draw Page Layout Formulas Data Review View Tell me e Share O Comments X Arial 10 AA General Σν Comments HH 23 Insert Delete y Paste B I AY Y % Ideas Conditional Format Formatting as Table Cell Styles Format Sort & Filter Find & Select v...
My question is how to solve the answers for the yellow blocks?
Is there any possible way I could get some help with this
question.
AutoSave OFF Unit 2 Ratio Data Home Insert Draw Page Layout Formulas Data Review View Tell me e Share O Comments X Arial 10 AA General Σν Comments HH 23 Insert Delete y Paste B I AY Y % Ideas Conditional Format Formatting as Table Cell Styles Format Sort & Filter Find & Select v...
Need Help filling in all yellow blocks. Thank you in advance! 2 Joshua & White Technologies:...
 Need Help filling in all yellow blocks. Thank you in
advance!
2 Joshua & White Technologies: December 31 Balance Sheets 3 Thousands of Dollars) 2016 21,000 3,759 52,500 Assets 6 Cash and cash equivalents Short-term investments 8 Accounts Receivable g Inventories 10 Total current assets 11 Net fixed assets 12 Total assets 2015 20,000 3,240 48,000 84000 56.000 $161,259 $127,240 218400 200,000 $379,659 $327 240 4 Liabilities and equity 15 Accounts payable 16 Accruals 17 Notes payable 18 Total current...
Need Help filling in all yellow blocks. Thank you in
advance!
2 Joshua & White Technologies: December 31 Balance Sheets 3 Thousands of Dollars) 2016 21,000 3,759 52,500 Assets 6 Cash and cash equivalents Short-term investments 8 Accounts Receivable g Inventories 10 Total current assets 11 Net fixed assets 12 Total assets 2015 20,000 3,240 48,000 84000 56.000 $161,259 $127,240 218400 200,000 $379,659 $327 240 4 Liabilities and equity 15 Accounts payable 16 Accruals 17 Notes payable 18 Total current...
What would be my answer for the liquidity ratios The first blue box? hes385r3_Financial_Performance_Worksheet_Week_4 Review View...
 What would be my answer for the liquidity ratios The first blue
box?
hes385r3_Financial_Performance_Worksheet_Week_4 Review View AutoSave OFF A S Home Insert DrawPage Layout Times New Roman 12 Paste BIV A B4 X v fx BALANCE SHEET Comments Formulas A A Q-Search Sheet Share EAY- O 4 Data = = 2 Wrap Text Merge & Center General $ % 3 E 48 2X Delete Format Sort & Filter Find A Select ideas Sensitivity Formatting as Table X Styles Hillside, Inc....
What would be my answer for the liquidity ratios The first blue
box?
hes385r3_Financial_Performance_Worksheet_Week_4 Review View AutoSave OFF A S Home Insert DrawPage Layout Times New Roman 12 Paste BIV A B4 X v fx BALANCE SHEET Comments Formulas A A Q-Search Sheet Share EAY- O 4 Data = = 2 Wrap Text Merge & Center General $ % 3 E 48 2X Delete Format Sort & Filter Find A Select ideas Sensitivity Formatting as Table X Styles Hillside, Inc....
Blooper’s analysts have come up with the following revised estimates for its magnoosium mine: Range Pessimistic...
 Blooper’s analysts have come up with the following revised
estimates for its magnoosium mine:
Range
Pessimistic
Optimistic
Initial investment
+
30
%
–
25
%
Revenues
–
25
%
+
20
%
Variable costs
+
25
%
–
15
%
Fixed cost
+
50
%
–
50
%
Working capital
+
30
%
–
45
%
Conduct a sensitivity analysis for each variable and range and
compute the NPV for each. Use Spreadsheet 10.1 and accompanying
data as a starting...
Blooper’s analysts have come up with the following revised
estimates for its magnoosium mine:
Range
Pessimistic
Optimistic
Initial investment
+
30
%
–
25
%
Revenues
–
25
%
+
20
%
Variable costs
+
25
%
–
15
%
Fixed cost
+
50
%
–
50
%
Working capital
+
30
%
–
45
%
Conduct a sensitivity analysis for each variable and range and
compute the NPV for each. Use Spreadsheet 10.1 and accompanying
data as a starting...
You have just been hired as a financial analyst for Lydex Company, a manufacturer of safety helmets. Your boss has asked...
You have just been hired as a financial analyst for Lydex Company, a manufacturer of safety helmets. Your boss has asked you to perform a comprehensive analysis of the company’s financial statements, including comparing Lydex’s performance to its major competitors. The company’s financial statements for the last two years are as follows: Lydex Company Comparative Balance Sheet This Year Last Year Assets Current assets: Cash $ 980,000 $ 1,220,000 Marketable securities 0 300,000 Accounts receivable, net 2,780,000 1,880,000 Inventory 3,620,000...
COMPLETE THE FOLLOWING USING THE ATTACHED DOCUMENTS In this exercise, you will perform a financial statement...
 COMPLETE THE FOLLOWING USING THE ATTACHED DOCUMENTS
In this exercise, you will perform a financial statement analysis for Water Feature Designers Inc. You will perform horizontal/vertical analyses and create charts to highlight key information from these analyses. You will also calculate financial ratios and insert cell comments. Use this information to complete the ratio analysis. Ratio Current Ratio Debt-to-Equity Ratio Profit Margin 2016 7.62 0.17 .186 2015 3.45 0.28 292 2014 8.21 0.18 255 1. Open EA9-A2-FSA from your Chapter...
COMPLETE THE FOLLOWING USING THE ATTACHED DOCUMENTS
In this exercise, you will perform a financial statement analysis for Water Feature Designers Inc. You will perform horizontal/vertical analyses and create charts to highlight key information from these analyses. You will also calculate financial ratios and insert cell comments. Use this information to complete the ratio analysis. Ratio Current Ratio Debt-to-Equity Ratio Profit Margin 2016 7.62 0.17 .186 2015 3.45 0.28 292 2014 8.21 0.18 255 1. Open EA9-A2-FSA from your Chapter...
 Consider the following
scenario: Your boss has come to you for advice on the current
finances of the company and needs you to create an extended DuPont
analysis, common size analysis, and percentage change analysis.
Your boss wants you to fill out the attached Excel file because
he/she has no idea what she is talking about and is going to use
your report as her work.
Remember to answer all the questions in the attached
document.
Has J&W's liquidity position...
Consider the following
scenario: Your boss has come to you for advice on the current
finances of the company and needs you to create an extended DuPont
analysis, common size analysis, and percentage change analysis.
Your boss wants you to fill out the attached Excel file because
he/she has no idea what she is talking about and is going to use
your report as her work.
Remember to answer all the questions in the attached
document.
Has J&W's liquidity position...
 Your boss is back. This time he/she provides you a partial model
to a bond valuation. This bond is a 20-year, 8% semiannual coupon
bond with a par value of $1,000 may be called in 5 years at a call
price of $1,040. The bond sells for $1,100. (Assume that the bond
has been issued.) She needs you to complete the partial model for
her. She needs the following to be answered.
What is the bond's yield to maturity?
What...
Your boss is back. This time he/she provides you a partial model
to a bond valuation. This bond is a 20-year, 8% semiannual coupon
bond with a par value of $1,000 may be called in 5 years at a call
price of $1,040. The bond sells for $1,100. (Assume that the bond
has been issued.) She needs you to complete the partial model for
her. She needs the following to be answered.
What is the bond's yield to maturity?
What...
 Notes Based on year-end balance sheet figures. Calculation is based on a 365-day year. SPREADSHEET PROBLEM (3-15) Analysis Start with the partial model in the file Ch03 P15 Build a Model.XIS From the textDOORS Web site. Joshua & White (J&W) Technology's financial statements are also shown here. Answer the following questions. (Note: Industry average ratios are provided in Ch03 P15 Build a Model.xlsx.) a. Has J&W's liquidity position improved or worsened? Explain. b. Has J&W's ability to manage its assets...
 My question is how to solve the answers for the yellow blocks?
Is there any possible way I could get some help with this
question.
AutoSave OFF Unit 2 Ratio Data Home Insert Draw Page Layout Formulas Data Review View Tell me e Share O Comments X Arial 10 AA General Σν Comments HH 23 Insert Delete y Paste B I AY Y % Ideas Conditional Format Formatting as Table Cell Styles Format Sort & Filter Find & Select v...
My question is how to solve the answers for the yellow blocks?
Is there any possible way I could get some help with this
question.
AutoSave OFF Unit 2 Ratio Data Home Insert Draw Page Layout Formulas Data Review View Tell me e Share O Comments X Arial 10 AA General Σν Comments HH 23 Insert Delete y Paste B I AY Y % Ideas Conditional Format Formatting as Table Cell Styles Format Sort & Filter Find & Select v...
 Need Help filling in all yellow blocks. Thank you in
advance!
2 Joshua & White Technologies: December 31 Balance Sheets 3 Thousands of Dollars) 2016 21,000 3,759 52,500 Assets 6 Cash and cash equivalents Short-term investments 8 Accounts Receivable g Inventories 10 Total current assets 11 Net fixed assets 12 Total assets 2015 20,000 3,240 48,000 84000 56.000 $161,259 $127,240 218400 200,000 $379,659 $327 240 4 Liabilities and equity 15 Accounts payable 16 Accruals 17 Notes payable 18 Total current...
Need Help filling in all yellow blocks. Thank you in
advance!
2 Joshua & White Technologies: December 31 Balance Sheets 3 Thousands of Dollars) 2016 21,000 3,759 52,500 Assets 6 Cash and cash equivalents Short-term investments 8 Accounts Receivable g Inventories 10 Total current assets 11 Net fixed assets 12 Total assets 2015 20,000 3,240 48,000 84000 56.000 $161,259 $127,240 218400 200,000 $379,659 $327 240 4 Liabilities and equity 15 Accounts payable 16 Accruals 17 Notes payable 18 Total current...
 What would be my answer for the liquidity ratios The first blue
box?
hes385r3_Financial_Performance_Worksheet_Week_4 Review View AutoSave OFF A S Home Insert DrawPage Layout Times New Roman 12 Paste BIV A B4 X v fx BALANCE SHEET Comments Formulas A A Q-Search Sheet Share EAY- O 4 Data = = 2 Wrap Text Merge & Center General $ % 3 E 48 2X Delete Format Sort & Filter Find A Select ideas Sensitivity Formatting as Table X Styles Hillside, Inc....
What would be my answer for the liquidity ratios The first blue
box?
hes385r3_Financial_Performance_Worksheet_Week_4 Review View AutoSave OFF A S Home Insert DrawPage Layout Times New Roman 12 Paste BIV A B4 X v fx BALANCE SHEET Comments Formulas A A Q-Search Sheet Share EAY- O 4 Data = = 2 Wrap Text Merge & Center General $ % 3 E 48 2X Delete Format Sort & Filter Find A Select ideas Sensitivity Formatting as Table X Styles Hillside, Inc....
 Blooper’s analysts have come up with the following revised
estimates for its magnoosium mine:
Range
Pessimistic
Optimistic
Initial investment
+
30
%
–
25
%
Revenues
–
25
%
+
20
%
Variable costs
+
25
%
–
15
%
Fixed cost
+
50
%
–
50
%
Working capital
+
30
%
–
45
%
Conduct a sensitivity analysis for each variable and range and
compute the NPV for each. Use Spreadsheet 10.1 and accompanying
data as a starting...
Blooper’s analysts have come up with the following revised
estimates for its magnoosium mine:
Range
Pessimistic
Optimistic
Initial investment
+
30
%
–
25
%
Revenues
–
25
%
+
20
%
Variable costs
+
25
%
–
15
%
Fixed cost
+
50
%
–
50
%
Working capital
+
30
%
–
45
%
Conduct a sensitivity analysis for each variable and range and
compute the NPV for each. Use Spreadsheet 10.1 and accompanying
data as a starting...
 COMPLETE THE FOLLOWING USING THE ATTACHED DOCUMENTS
In this exercise, you will perform a financial statement analysis for Water Feature Designers Inc. You will perform horizontal/vertical analyses and create charts to highlight key information from these analyses. You will also calculate financial ratios and insert cell comments. Use this information to complete the ratio analysis. Ratio Current Ratio Debt-to-Equity Ratio Profit Margin 2016 7.62 0.17 .186 2015 3.45 0.28 292 2014 8.21 0.18 255 1. Open EA9-A2-FSA from your Chapter...
COMPLETE THE FOLLOWING USING THE ATTACHED DOCUMENTS
In this exercise, you will perform a financial statement analysis for Water Feature Designers Inc. You will perform horizontal/vertical analyses and create charts to highlight key information from these analyses. You will also calculate financial ratios and insert cell comments. Use this information to complete the ratio analysis. Ratio Current Ratio Debt-to-Equity Ratio Profit Margin 2016 7.62 0.17 .186 2015 3.45 0.28 292 2014 8.21 0.18 255 1. Open EA9-A2-FSA from your Chapter...
Most questions answered within 3 hours.
-
Where is the error in this code sequence?
String s1 = "Hello";
String s2 = "ello";...
asked 10 months ago -
Financial data for Joel de Paris, Inc., for last year
follow:
Joel de Paris, Inc.
Balance...
asked 10 months ago -
Consider this reaction:
Al2(SO4)3 (aq)+ BaCl3
(aq) Al2Cl6 (aq)- +
3BaSO4(s) . What is the...
asked 10 months ago -
Suppose that Savneet is considering increasing her
recent random sample from 20 car rentals to 40...
asked 10 months ago -
Trucks arrive at an unloading terminal at an average rate of 120
per hour.
Trucks arrive...
asked 10 months ago -
Why are methanol and ethanol completely soluble in water while
octanol is not very little soluble....
asked 10 months ago -
A facilities manager at a university reads in a research report
that the mean amount of...
asked 10 months ago -
When the CuSO4 is rehydrated by adding water to the anhydrous
compound, is this an endothermic...
asked 10 months ago -
A ray of sunlight is passing from diamond into crown glass; the
angle of incidence is...
asked 10 months ago -
A block of mass 0.249 kg is placed on top of a light, vertical
spring of...
asked 10 months ago -
how do the kidneys compensate in the presences of acidosis
a) trigger hyperventilate
b) reserve acid...
asked 10 months ago -
Question 501 pts
The rental rate of capital to the firm increases. Which of the
following...
asked 10 months ago