
Homework Answers
Solution:-
a)
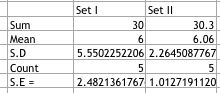
For Set I
State the hypotheses. The first step is to state the null hypothesis and an alternative hypothesis.
Null hypothesis: u = 10
Alternative hypothesis: u 10
Note that these hypotheses constitute a two-tailed test. The null hypothesis will be rejected if the sample mean is too big or if it is too small.
Formulate an analysis plan. For this analysis, the significance level is 0.05. The test method is a one-sample t-test.
Analyze sample data. Using sample data, we compute the standard error (SE), degrees of freedom (DF), and the t statistic test statistic (t).
SE = s / sqrt(n)
S.E = 2.4821
DF = n - 1
D.F = 4
t = (x - u) / SE
t = -1.61
where s is the standard deviation of the sample, x is the sample mean, u is the hypothesized population mean, and n is the sample size.
Since we have a two-tailed test, the P-value is the probability that the t statistic having 4 degrees of freedom is less than -1.61 or greater than 1.61.
Thus, the P-value = 0.183.
Interpret results. Since the P-value (0.183) is greater than the significance level (0.05), we cannot reject the null hypothesis.
For Set II
State the hypotheses. The first step is to state the null hypothesis and an alternative hypothesis.
Null hypothesis: u = 10
Alternative hypothesis: u 10
Note that these hypotheses constitute a two-tailed test. The null hypothesis will be rejected if the sample mean is too big or if it is too small.
Formulate an analysis plan. For this analysis, the significance level is 0.05. The test method is a one-sample t-test.
Analyze sample data. Using sample data, we compute the standard error (SE), degrees of freedom (DF), and the t statistic test statistic (t).
SE = s / sqrt(n)
S.E = 1.0127
DF = n - 1
D.F = 4
t = (x - u) / SE
t = - 3.89
where s is the standard deviation of the sample, x is the sample mean, u is the hypothesized population mean, and n is the sample size.
Since we have a two-tailed test, the P-value is the probability that the t statistic having 4 degrees of freedom is less than -3.89 or greater than 3.89.
Thus, the P-value = 0.018
Interpret results. Since the P-value (0.018) is less than the significance level (0.05), we have to reject the null hypothesis.
b) Yes the conclusions of the tests are reasonable.
Add Answer to:
The following two sample data sets both have sample mean 6. Set I 13.4 3.7 0.8...
Please solve it correctly I post this question before but I’m not sure about the solution...
 Please solve it correctly I post this question before but I’m
not sure about the solution that I got . the sample mean here is ((
6 )) for both sample sets
The following two sample data sets both have sample mean 6 Set I 13.4 3.7 0.8 10.3 1.8 Set II 2.6 8.2 5.2 7.2 6.8 (a) If μ is the population mean perform t-tests for each set to test Ho : μ 10 against 14: μ #10. Use...
Please solve it correctly I post this question before but I’m
not sure about the solution that I got . the sample mean here is ((
6 )) for both sample sets
The following two sample data sets both have sample mean 6 Set I 13.4 3.7 0.8 10.3 1.8 Set II 2.6 8.2 5.2 7.2 6.8 (a) If μ is the population mean perform t-tests for each set to test Ho : μ 10 against 14: μ #10. Use...
Please read what I write first this is the third time I post this question I...
 Please read what I write first
this is the third time I post this question I want a correct answer
. If you don’t know how to solve it then do not solve it there are
others experts can solve it . I post this question yesterday for a
second time and someone just copy and peast I wrong answer from the
first time I post this question .
**** HERE the sample mean is ((Equal)) to six for Both...
Please read what I write first
this is the third time I post this question I want a correct answer
. If you don’t know how to solve it then do not solve it there are
others experts can solve it . I post this question yesterday for a
second time and someone just copy and peast I wrong answer from the
first time I post this question .
**** HERE the sample mean is ((Equal)) to six for Both...
If you have two data sets with the following information. Both data have a mean of...
If you have two data sets with the following information. Both data have a mean of 100. In Data set one: The 25th quartile 50, the 50th is 100, and the 75th is 150. Data set two: The 25th quartile 75, the 50th is 100, and the 75th is 300. Which data set is more symmetric and why do you think that?
The data on the below shows the number of hours a particular drug is in the...
The data on the below shows the number of hours a particular drug is in the system of 200 females. Develop a histogram of this data according to the following intervals: Follow the directions. Test the hypothesis that these data are distributed exponentially. Determine the test statistic. Round to two decimal places. (sort the data first) [0, 3) [3, 6) [6, 9) [9, 12) [12, 18) [18, 24) [24, infinity) 34.7 11.8 10 7.8 2.8 20 9.8 20.4 1.2 7.2...
Consider the following two sample data sets. Set 1: 6 39 8 7 0 Set 2:...
 Consider the following two sample data sets. Set 1: 6 39 8 7 0 Set 2: 2 16 18 7 4 a. Calculate the coefficient of variation for each data set. b. Which data set has more variability? a. The coefficient of variation for set 1 is %. (Round to one decimal place as needed.)
In the picture below, I have the output for the same two sets of data. I ran the hypothesis test and the confidence interval. If you had a choice to use one output or the other, which would you choose...
In the picture below, I have the output for the same two sets of data. I ran the hypothesis test and the confidence interval. If you had a choice to use one output or the other, which would you choose and why? Make sure to be specific and include what information you get from each and what information you don't get if you use one over the other. Options Two sample T summary hypothesis test: : Mean of Population 1...
Each of the following three data sets represents the 1Q scores of a random sample For...
 Each of the following three data sets represents the 1Q scores of a random sample For each data set, compute the mean and median. of adults. IQ scores are known to have a mean and median of 100. What is the mean of the sample of size 5? Full data set Sample of Size 5 104 108 105 91 Type an integer or decimal rounded to one decimal place as needed.) What is the mean of the sample of size...
Assume that you have a sample of n 1-7, with the sample mean X1-43, and a...
 Assume that you have a sample of n 1-7, with the sample mean X1-43, and a sample standard deviation of S1-4, and you have an independent sample of n2-13 from another population with a sample mean of x2 39 and the sample standard deviation S2-7. Complete parts (a) through (d). Click here for page 1 of critical values oft. Click here for page 2 of critical values of t. a. What is the value of the pooled-variance ISTAT test statistic...
If I run an ANOVA on a two-sample data set, and get F(1, 12) = 4.56,...
If I run an ANOVA on a two-sample data set, and get F(1, 12) = 4.56, what would be the corresponding t-value if I would have just used a t-test? How do you know? What is the corresponding p -value? Would you consider this result statistically significant?
1. You measure 42 textbooks' weights, and find they have a mean weight of 47 ounces....
1. You measure 42 textbooks' weights, and find they have a mean weight of 47 ounces. Assume the population standard deviation is 3.5 ounces. Based on this, construct a 90% confidence interval for the true population mean textbook weight. Give your answers as decimals, to two places 2.If n=16, ¯xx¯(x-bar)=43, and s=13, construct a confidence interval at a 99% confidence level. Assume the data came from a normally distributed population. Give your answers to one decimal place. 3.SAT scores are...
 Please solve it correctly I post this question before but I’m
not sure about the solution that I got . the sample mean here is ((
6 )) for both sample sets
The following two sample data sets both have sample mean 6 Set I 13.4 3.7 0.8 10.3 1.8 Set II 2.6 8.2 5.2 7.2 6.8 (a) If μ is the population mean perform t-tests for each set to test Ho : μ 10 against 14: μ #10. Use...
Please solve it correctly I post this question before but I’m
not sure about the solution that I got . the sample mean here is ((
6 )) for both sample sets
The following two sample data sets both have sample mean 6 Set I 13.4 3.7 0.8 10.3 1.8 Set II 2.6 8.2 5.2 7.2 6.8 (a) If μ is the population mean perform t-tests for each set to test Ho : μ 10 against 14: μ #10. Use...
 Please read what I write first
this is the third time I post this question I want a correct answer
. If you don’t know how to solve it then do not solve it there are
others experts can solve it . I post this question yesterday for a
second time and someone just copy and peast I wrong answer from the
first time I post this question .
**** HERE the sample mean is ((Equal)) to six for Both...
Please read what I write first
this is the third time I post this question I want a correct answer
. If you don’t know how to solve it then do not solve it there are
others experts can solve it . I post this question yesterday for a
second time and someone just copy and peast I wrong answer from the
first time I post this question .
**** HERE the sample mean is ((Equal)) to six for Both...
 Consider the following two sample data sets. Set 1: 6 39 8 7 0 Set 2: 2 16 18 7 4 a. Calculate the coefficient of variation for each data set. b. Which data set has more variability? a. The coefficient of variation for set 1 is %. (Round to one decimal place as needed.)
 Each of the following three data sets represents the 1Q scores of a random sample For each data set, compute the mean and median. of adults. IQ scores are known to have a mean and median of 100. What is the mean of the sample of size 5? Full data set Sample of Size 5 104 108 105 91 Type an integer or decimal rounded to one decimal place as needed.) What is the mean of the sample of size...
 Assume that you have a sample of n 1-7, with the sample mean X1-43, and a sample standard deviation of S1-4, and you have an independent sample of n2-13 from another population with a sample mean of x2 39 and the sample standard deviation S2-7. Complete parts (a) through (d). Click here for page 1 of critical values oft. Click here for page 2 of critical values of t. a. What is the value of the pooled-variance ISTAT test statistic...
Most questions answered within 3 hours.
-
Where is the error in this code sequence?
String s1 = "Hello";
String s2 = "ello";...
asked 10 months ago -
Financial data for Joel de Paris, Inc., for last year
follow:
Joel de Paris, Inc.
Balance...
asked 10 months ago -
Consider this reaction:
Al2(SO4)3 (aq)+ BaCl3
(aq) Al2Cl6 (aq)- +
3BaSO4(s) . What is the...
asked 10 months ago -
Suppose that Savneet is considering increasing her
recent random sample from 20 car rentals to 40...
asked 10 months ago -
Trucks arrive at an unloading terminal at an average rate of 120
per hour.
Trucks arrive...
asked 10 months ago -
Why are methanol and ethanol completely soluble in water while
octanol is not very little soluble....
asked 10 months ago -
A facilities manager at a university reads in a research report
that the mean amount of...
asked 10 months ago -
When the CuSO4 is rehydrated by adding water to the anhydrous
compound, is this an endothermic...
asked 10 months ago -
A ray of sunlight is passing from diamond into crown glass; the
angle of incidence is...
asked 10 months ago -
A block of mass 0.249 kg is placed on top of a light, vertical
spring of...
asked 10 months ago -
how do the kidneys compensate in the presences of acidosis
a) trigger hyperventilate
b) reserve acid...
asked 10 months ago -
Question 501 pts
The rental rate of capital to the firm increases. Which of the
following...
asked 10 months ago