
Homework Answers
(a)
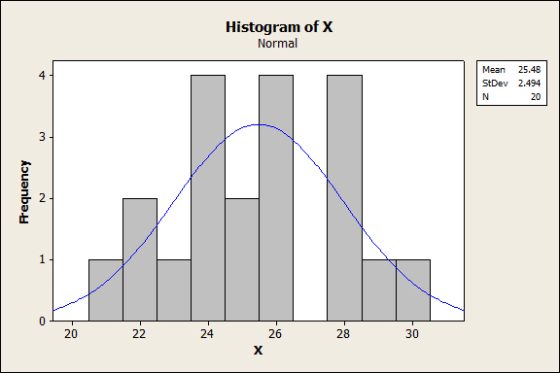
Descriptive Statistics: X
Variable Mean StDev Variance Minimum Q1 Median Q3 Maximum
X 25.475 2.494 6.218 20.800 24.025 25.350 27.675 30.100
N for
Variable IQR Mode Mode Skewness Kurtosis
X 3.650 24.4 3 -0.05 -0.66

Almost symmetric and platykurtic.
(b)
(c)
(d)

From the above plot it is observed that the data come from
normal distribution.
Add Answer to:
1. (R) An interior automotive supplier places several electrical wires in a harness. A pull test...
Exercise 3. An automotive supplier of interior parts places several electrical wires in a harness. A...
 Exercise 3. An automotive supplier of interior parts places several electrical wires in a harness. A pull test measures the force required to pull spliced wires apart. A customer requires that each wire spliced into the harness must with-stand a pull force of 20 pounds. Let X equal the pull force required to pull 20 gauge wires apart. Assume that X ~ N(u, o). The following data give 20 observations of X: 28.8 20.8 24.4 30.1 25.6 26.4 27.7 24.4...
NOTE: PLEASE INCLUDE ALL THE R CODES ALONG WITH THE PLOTS Instructions: Questions labeled with (R)...
 NOTE: PLEASE INCLUDE ALL THE R CODES ALONG WITH THE
PLOTS
Instructions: Questions labeled with (R) require use of R. Please provide appropriate R commands and their output, along with sufficient explanation and interpretation of the output to demonstrate your understanding. All other questions should be completed without reference to any R commands or output. Make sure you give enough explanation so your tutor can follow your reasoning if you happen to make a mistake. Please also try to be...
NOTE: PLEASE INCLUDE ALL THE R CODES ALONG WITH THE
PLOTS
Instructions: Questions labeled with (R) require use of R. Please provide appropriate R commands and their output, along with sufficient explanation and interpretation of the output to demonstrate your understanding. All other questions should be completed without reference to any R commands or output. Make sure you give enough explanation so your tutor can follow your reasoning if you happen to make a mistake. Please also try to be...
 Exercise 3. An automotive supplier of interior parts places several electrical wires in a harness. A pull test measures the force required to pull spliced wires apart. A customer requires that each wire spliced into the harness must with-stand a pull force of 20 pounds. Let X equal the pull force required to pull 20 gauge wires apart. Assume that X ~ N(u, o). The following data give 20 observations of X: 28.8 20.8 24.4 30.1 25.6 26.4 27.7 24.4...
 NOTE: PLEASE INCLUDE ALL THE R CODES ALONG WITH THE
PLOTS
Instructions: Questions labeled with (R) require use of R. Please provide appropriate R commands and their output, along with sufficient explanation and interpretation of the output to demonstrate your understanding. All other questions should be completed without reference to any R commands or output. Make sure you give enough explanation so your tutor can follow your reasoning if you happen to make a mistake. Please also try to be...
NOTE: PLEASE INCLUDE ALL THE R CODES ALONG WITH THE
PLOTS
Instructions: Questions labeled with (R) require use of R. Please provide appropriate R commands and their output, along with sufficient explanation and interpretation of the output to demonstrate your understanding. All other questions should be completed without reference to any R commands or output. Make sure you give enough explanation so your tutor can follow your reasoning if you happen to make a mistake. Please also try to be...
Most questions answered within 3 hours.
-
Where is the error in this code sequence?
String s1 = "Hello";
String s2 = "ello";...
asked 11 months ago -
Financial data for Joel de Paris, Inc., for last year
follow:
Joel de Paris, Inc.
Balance...
asked 11 months ago -
Consider this reaction:
Al2(SO4)3 (aq)+ BaCl3
(aq) Al2Cl6 (aq)- +
3BaSO4(s) . What is the...
asked 11 months ago -
Suppose that Savneet is considering increasing her
recent random sample from 20 car rentals to 40...
asked 11 months ago -
Trucks arrive at an unloading terminal at an average rate of 120
per hour.
Trucks arrive...
asked 11 months ago -
Why are methanol and ethanol completely soluble in water while
octanol is not very little soluble....
asked 11 months ago -
A facilities manager at a university reads in a research report
that the mean amount of...
asked 11 months ago -
When the CuSO4 is rehydrated by adding water to the anhydrous
compound, is this an endothermic...
asked 11 months ago -
A ray of sunlight is passing from diamond into crown glass; the
angle of incidence is...
asked 11 months ago -
A block of mass 0.249 kg is placed on top of a light, vertical
spring of...
asked 11 months ago -
how do the kidneys compensate in the presences of acidosis
a) trigger hyperventilate
b) reserve acid...
asked 11 months ago -
Question 501 pts
The rental rate of capital to the firm increases. Which of the
following...
asked 11 months ago