
Homework Answers
Add Answer to:
(1 point) The figure below shows the distribution of temperature, in degrees C, in a 5...
(1 point) The figure below shows the distribution of temperature, in degrees C, in a 5...
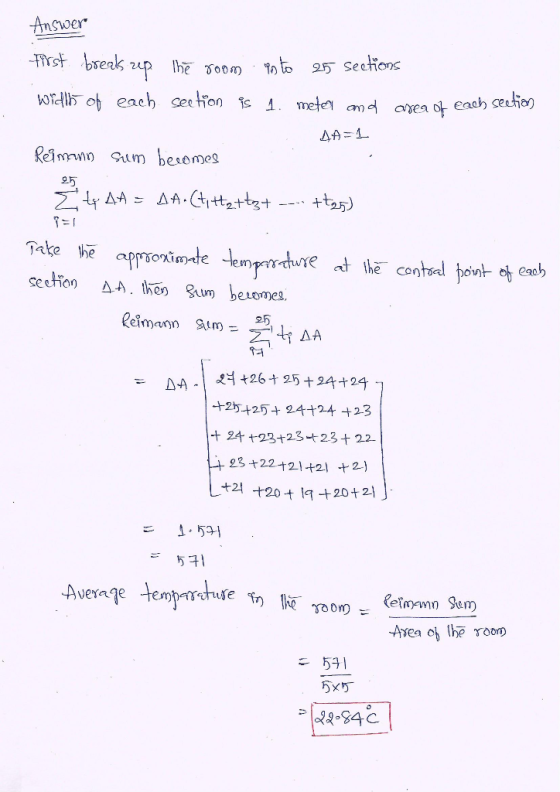
 (1 point) The figure below shows the distribution of temperature, in degrees C, in a 5 meter by 5 meter heated room. 28 27 26 25 24 23 22 21. 20 19 4 Using Riemann sums, estimate the average temperature in the room. average temperature
(1 point) The figure below shows the distribution of temperature, in degrees C, in a 5 meter by 5 meter heated room. 28 27 26 25 24 23 22 21. 20 19 4 Using Riemann...
(1 point) The figure below shows the distribution of temperature, in degrees C, in a 5 meter by 5 meter heated room. 28 27 26 25 24 23 22 21. 20 19 4 Using Riemann sums, estimate the average temperature in the room. average temperature
(1 point) The figure below shows the distribution of temperature, in degrees C, in a 5 meter by 5 meter heated room. 28 27 26 25 24 23 22 21. 20 19 4 Using Riemann...
What is a thermistor? (3pt.) A. B. What property of the thermistor changes with temperature? (2pt.) C. The figure shows temperature response measured by the thermistor. From the temperature vs time r...
 What is a thermistor? (3pt.) A. B. What property of the thermistor changes with temperature? (2pt.) C. The figure shows temperature response measured by the thermistor. From the temperature vs time response, compute the 10% to 90% rise time and the 10% to 90% fall time. (5pt) 32 31 30 29 O 28 27 26 Heat Released e 25 24 23 21 19 Heat Applied 18 10 15 20 25 30 35 40 45 50 55 6065 70 75 80...
Solve using Minitab. The table is observations on weekly operational downtime on a critical equipment (order...
 Solve using Minitab.
The table is observations on weekly operational downtime on a critical equipment (order read top to bottom and left to right). The target value for the mean is 25. (a) Estimate the process standard deviation. (b) Set up and apply a tabular cusum chart for this process using standardized values h 5 and k = 2. (c) Interpret the cusum chart - 27 24 22 27 25 27 23 20 28 29 24 28 20 29 21...
Solve using Minitab.
The table is observations on weekly operational downtime on a critical equipment (order read top to bottom and left to right). The target value for the mean is 25. (a) Estimate the process standard deviation. (b) Set up and apply a tabular cusum chart for this process using standardized values h 5 and k = 2. (c) Interpret the cusum chart - 27 24 22 27 25 27 23 20 28 29 24 28 20 29 21...
What is the relative humidity in a room if the dew point temperature is 5 degrees...
What is the relative humidity in a room if the dew point temperature is 5 degrees C and the room temperature is 24 degrees C? MultipleChoice: A) 33 % B) 345 % C) 29 % D) 37 % Saturated Vapor Pressure Table Temperature Pressure °F °C mmHg 32 0 4.62 41 5 6.5 50 10 9.2 59 15 12.8 63 17 14.5 68 20 17.5 72 22 19.8 75 24 22.4 79 26 25.2 82 28 28.3
1 A measurement systems experiment involving 20 parts, three operators, and two measurements per ...
 1 A measurement systems experiment involving 20 parts, three operators, and two measurements per part is shown in Table 8E. 12. (a) Estimate the repeatability and reproducibility of the gauge (b) What is the estimate of total gauge variability? (c) If the product specifications are at LSL 6 and USIL - 60, what ca you say about gauge capa bility? TABLE 8E. 12 Measurement Data for Exercise 8.34 Operator 1 Operator 2 Operator 3 Measurements Measurements Measurements Part Number 1...
A soft drink manufacturer uses fire agents to handle premium distribution for is various products. The marketing director desired to study the timeliness with which the premiums are distributed. Twent...
A soft drink manufacturer uses fire agents to handle premium distribution for is various products. The marketing director desired to study the timeliness with which the premiums are distributed. Twenty transactions for each agent were selected at random and the time lapse (in days) for handling each transaction was determined. The results follow: Agent 1 Agent 2 Agent 3 Agent 4 Agent 5 24 18 10 15 33 24 20 11 13 22 29 20 8 18 28 20 24...
Question #5: A statistics teacher wants to see whether there is a statistically significant difference in...
 Question #5: A statistics teacher wants to see whether there is a statistically significant difference in the ages of day students and night students. A random sample of 31 students is selected from each group. The data are given below. Test the claim that there is difference in the mean ages of the two groups. Use a 0.01 Day Students: 22 24 24 23 19 19 23 22 18 21 21 18 18 25 29 24 23 22 22 21...
Therefore, for this program you will read the data in the file named weatherdata_2.txt into arrays...
Therefore, for this program you will read the data in the file named weatherdata_2.txt into arrays for the wind speed and for the temperature. You will then use the stored data to calculate and output the average wind speed and the average temperature. Create a constant with a value of 30 and use that to declare and loop through your arrays and as a divisor to produce your averages. Here is the data file (below). 1. 14 25 2. 12...
4) Now that Continental can detect more defects before the Silver Box is shipped, I decided...
 4) Now that Continental can detect more defects before the Silver Box is shipped, I decided process Improvements in its circuit board fabrication department would further improve quality. So, for one process they collected the following data this morning to set up a mean control chart. Since the process mean is unknown, estimate the mean and find the UCL and LCL for a 3-sigma mean control chart using this morning's samples. Sample 1 - 24, 24, 25, 22, 21 Sample...
I need help using python ( spyder) only use files , loops if needed is statement do not use , def...
 i need help using python ( spyder)
only use files , loops if needed
is statement
do not use , def function or any other.
Exercise 1: Daily temperature is recorded for some weeks in files (templ.txt", temp2.txt, and temp3.txt; provided in the MOODLE). The first line contains number of weeks and the rest of the lines each represent the week number followed by temperature on the seven days of that week (see samples input files below). Write a python...
i need help using python ( spyder)
only use files , loops if needed
is statement
do not use , def function or any other.
Exercise 1: Daily temperature is recorded for some weeks in files (templ.txt", temp2.txt, and temp3.txt; provided in the MOODLE). The first line contains number of weeks and the rest of the lines each represent the week number followed by temperature on the seven days of that week (see samples input files below). Write a python...
 (1 point) The figure below shows the distribution of temperature, in degrees C, in a 5 meter by 5 meter heated room. 28 27 26 25 24 23 22 21. 20 19 4 Using Riemann sums, estimate the average temperature in the room. average temperature
(1 point) The figure below shows the distribution of temperature, in degrees C, in a 5 meter by 5 meter heated room. 28 27 26 25 24 23 22 21. 20 19 4 Using Riemann...
(1 point) The figure below shows the distribution of temperature, in degrees C, in a 5 meter by 5 meter heated room. 28 27 26 25 24 23 22 21. 20 19 4 Using Riemann sums, estimate the average temperature in the room. average temperature
(1 point) The figure below shows the distribution of temperature, in degrees C, in a 5 meter by 5 meter heated room. 28 27 26 25 24 23 22 21. 20 19 4 Using Riemann...
 What is a thermistor? (3pt.) A. B. What property of the thermistor changes with temperature? (2pt.) C. The figure shows temperature response measured by the thermistor. From the temperature vs time response, compute the 10% to 90% rise time and the 10% to 90% fall time. (5pt) 32 31 30 29 O 28 27 26 Heat Released e 25 24 23 21 19 Heat Applied 18 10 15 20 25 30 35 40 45 50 55 6065 70 75 80...
 Solve using Minitab.
The table is observations on weekly operational downtime on a critical equipment (order read top to bottom and left to right). The target value for the mean is 25. (a) Estimate the process standard deviation. (b) Set up and apply a tabular cusum chart for this process using standardized values h 5 and k = 2. (c) Interpret the cusum chart - 27 24 22 27 25 27 23 20 28 29 24 28 20 29 21...
Solve using Minitab.
The table is observations on weekly operational downtime on a critical equipment (order read top to bottom and left to right). The target value for the mean is 25. (a) Estimate the process standard deviation. (b) Set up and apply a tabular cusum chart for this process using standardized values h 5 and k = 2. (c) Interpret the cusum chart - 27 24 22 27 25 27 23 20 28 29 24 28 20 29 21...
 1 A measurement systems experiment involving 20 parts, three operators, and two measurements per part is shown in Table 8E. 12. (a) Estimate the repeatability and reproducibility of the gauge (b) What is the estimate of total gauge variability? (c) If the product specifications are at LSL 6 and USIL - 60, what ca you say about gauge capa bility? TABLE 8E. 12 Measurement Data for Exercise 8.34 Operator 1 Operator 2 Operator 3 Measurements Measurements Measurements Part Number 1...
 Question #5: A statistics teacher wants to see whether there is a statistically significant difference in the ages of day students and night students. A random sample of 31 students is selected from each group. The data are given below. Test the claim that there is difference in the mean ages of the two groups. Use a 0.01 Day Students: 22 24 24 23 19 19 23 22 18 21 21 18 18 25 29 24 23 22 22 21...
 4) Now that Continental can detect more defects before the Silver Box is shipped, I decided process Improvements in its circuit board fabrication department would further improve quality. So, for one process they collected the following data this morning to set up a mean control chart. Since the process mean is unknown, estimate the mean and find the UCL and LCL for a 3-sigma mean control chart using this morning's samples. Sample 1 - 24, 24, 25, 22, 21 Sample...
 i need help using python ( spyder)
only use files , loops if needed
is statement
do not use , def function or any other.
Exercise 1: Daily temperature is recorded for some weeks in files (templ.txt", temp2.txt, and temp3.txt; provided in the MOODLE). The first line contains number of weeks and the rest of the lines each represent the week number followed by temperature on the seven days of that week (see samples input files below). Write a python...
i need help using python ( spyder)
only use files , loops if needed
is statement
do not use , def function or any other.
Exercise 1: Daily temperature is recorded for some weeks in files (templ.txt", temp2.txt, and temp3.txt; provided in the MOODLE). The first line contains number of weeks and the rest of the lines each represent the week number followed by temperature on the seven days of that week (see samples input files below). Write a python...
Most questions answered within 3 hours.
-
Where is the error in this code sequence?
String s1 = "Hello";
String s2 = "ello";...
asked 10 months ago -
Financial data for Joel de Paris, Inc., for last year
follow:
Joel de Paris, Inc.
Balance...
asked 10 months ago -
Consider this reaction:
Al2(SO4)3 (aq)+ BaCl3
(aq) Al2Cl6 (aq)- +
3BaSO4(s) . What is the...
asked 10 months ago -
Suppose that Savneet is considering increasing her
recent random sample from 20 car rentals to 40...
asked 10 months ago -
Trucks arrive at an unloading terminal at an average rate of 120
per hour.
Trucks arrive...
asked 10 months ago -
Why are methanol and ethanol completely soluble in water while
octanol is not very little soluble....
asked 10 months ago -
A facilities manager at a university reads in a research report
that the mean amount of...
asked 10 months ago -
When the CuSO4 is rehydrated by adding water to the anhydrous
compound, is this an endothermic...
asked 10 months ago -
A ray of sunlight is passing from diamond into crown glass; the
angle of incidence is...
asked 10 months ago -
A block of mass 0.249 kg is placed on top of a light, vertical
spring of...
asked 10 months ago -
how do the kidneys compensate in the presences of acidosis
a) trigger hyperventilate
b) reserve acid...
asked 10 months ago -
Question 501 pts
The rental rate of capital to the firm increases. Which of the
following...
asked 10 months ago