 Please solve on only PART 2 b)
and c) , PART 1 is only for REFERENCE :)
Please solve on only PART 2 b)
and c) , PART 1 is only for REFERENCE :)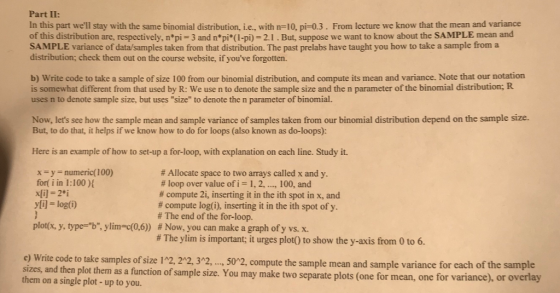
Homework Answers
(b) We use the rbinom function to draw a sample
of size 100 from the binomial distribution p(x) and then calculate
mean and variance in the following way:
a = rbinom(100, 10, 0.3)
mean(a)
var(a)
(c) We compute the 2 graphs in the following way:
x1 = x2 = y = numeric(50)
for(i in 1:50)
{
y[i] = i^2
x1[i] = mean(rbinom(y[i],10,0.3))
x2[i] = var(rbinom(y[i],10,0.3))
}
par(mfrow=c(1,2))
plot(y,x1,type="o",main="Sample size vs Means")
plot(y,x2,type="o",main="Sample size vs Variances")
Add Answer to:
Please solve on only PART 2 b) and c) , PART 1 is only for REFERENCE...
Part I: Ene concept of a percentile (equivalently, quantile) is very important in data analysis. It...
 Part I: Ene concept of a percentile (equivalently, quantile) is very important in data analysis. It applies to both samples and distributions. So, let's get some wi practice with them, starting with the binomial distribution. In prelab, you learned that the function gbinom(p. size prob) gives the p-th quantile of the binomial distribution with parameters n - size and pi prob. tocus on the binomial distribution with parameters n-10 and pi-0.3.Then, the 38th percentile (or 0.38 quantile) of that distribution...
please i need to solve 2 and 3 and please explain everything and write I commend...
 please i need to solve 2 and 3 and please explain everything
and write I commend
sing R please, 1. Generate 5,000 iid samples from the standard normal distribution; compute the mean of these random samples. Repeat this process 100 times so you would have stored 100 sample averages. Plot the sample averages using hist() and lines(density() in R. What do you observe? 2. Compute the mean and variance of Binomial distribution with parameters m and p directly from definition...
please i need to solve 2 and 3 and please explain everything
and write I commend
sing R please, 1. Generate 5,000 iid samples from the standard normal distribution; compute the mean of these random samples. Repeat this process 100 times so you would have stored 100 sample averages. Plot the sample averages using hist() and lines(density() in R. What do you observe? 2. Compute the mean and variance of Binomial distribution with parameters m and p directly from definition...
Part D: 1. Draw 500 random samples of size 8 from a random number generator from...
 Part D: 1. Draw 500 random samples of size 8 from a random number generator from a standard normal distribution. Then increase the sample size to 32. Finally, increase the sample size to 128. Plot histograms of the sampling distributions of (i) the sample mean andi) the sample variance, for each of these three sample sizes. Now repeat your experiments for three samples drawn from another parametric distribution of your choice (e.g., a uniform distribution) Discuss the results of your...
please solve b and c part i) 0,25. For rand population, obta Jon distribution of X...
 please solve b and c part i)
0,25. For rand population, obta Jon distribution of X and Y. Are 8 and Y Hupunuent? 4+2 (b) Ages of 5 persons have me ons have incan recorded as (in years) 14, 19. 17, 25. For random samples of size 3 drawn without replacement from this ulation, obtain the sampling distribution of sample mean (K). Show at the mean of x equals the population mean and obtain the standard 2+2+2 (c) (i) Form...
please solve b and c part i)
0,25. For rand population, obta Jon distribution of X and Y. Are 8 and Y Hupunuent? 4+2 (b) Ages of 5 persons have me ons have incan recorded as (in years) 14, 19. 17, 25. For random samples of size 3 drawn without replacement from this ulation, obtain the sampling distribution of sample mean (K). Show at the mean of x equals the population mean and obtain the standard 2+2+2 (c) (i) Form...
This is a multiple choice problem. The answer is either A, B, or C. In San...
This is a multiple choice problem. The answer is either A, B, or C. In San Francisco, 30% of workers take public transportation. A sample of 10 workers is chosen. To find the probability that exactly 3 workers out of the sample of ten take public transportation, we would compute: A.) the cumulative binomial distribution with n = 3, p = 0.3, and x = 10 B.) the binomial probability mass function with n = 10, p = 0.3, and...
Lesson 6.2.4: Binomial Distribution and Sample Proportions A sample proportion, such as the one computed in...
 Lesson 6.2.4: Binomial Distribution and Sample Proportions A sample proportion, such as the one computed in Question 4, is equal to a number of successes (x), divided by the sample size (n). The notation for a sample proportion is p, and it is computed by the formula p = Each value of x corresponds to a unique sample proportion ( p ), as computed by this formula. For example, x = 1 implies p = + - 0.10. These events,...
The following distributional facts apply in this part: All variables are jointly normal and the marginals...
The following distributional facts apply in this part: All variables are jointly normal and the marginals are as follows: N(m,s ): This is the notation for the Normal distribution with mean m and standard deviations . X~N(5,2) Y~N(2,3) Z~N(0,1) W~N(-4,6) U~N(0,5) V~N(24,1) Covariances between these variables are: sxy =.4, sxw =-.5, swu =1, suv =2; allothercovariancesare0. We have a random sample of size 6 from the distribution of X. We have a random sample of size 10 from the distribution...
Part Two. Can you help me with the binomial probability distribution? Please see instructions below. Please...
 Part Two. Can you help me with the binomial probability
distribution? Please see instructions below.
Please show all steps to understand better. Thank you in
advance.
5. Use the binomial distribution table to find the binomial probabilities for these cases: a) n=10, p=1, k= 3 b) n=14, p = 6, k = 7 c) n =25, p=5, k = 14 6. Consider a binomial experiment with n = 20 and p=0.70. Use the binomial formula to calculate: a) P(x =...
Part Two. Can you help me with the binomial probability
distribution? Please see instructions below.
Please show all steps to understand better. Thank you in
advance.
5. Use the binomial distribution table to find the binomial probabilities for these cases: a) n=10, p=1, k= 3 b) n=14, p = 6, k = 7 c) n =25, p=5, k = 14 6. Consider a binomial experiment with n = 20 and p=0.70. Use the binomial formula to calculate: a) P(x =...
Help me the part b please, if possible part c too The binomial distribution is B(n,pl-probability...
 Help me the part b please, if
possible part c too
The binomial distribution is B(n,pl-probability for variable X to be equal to K P(X-k) with m we define-np, which is the probability of success for n events each with probability p we take the limit when う00 (we consider a very large number of events M-1 2 Mass (Da) 2. Poisson distribution a. Show that the Poisson distribution,p(kl)arises from the binomial distribution in the limit that p 1 and...
Help me the part b please, if
possible part c too
The binomial distribution is B(n,pl-probability for variable X to be equal to K P(X-k) with m we define-np, which is the probability of success for n events each with probability p we take the limit when う00 (we consider a very large number of events M-1 2 Mass (Da) 2. Poisson distribution a. Show that the Poisson distribution,p(kl)arises from the binomial distribution in the limit that p 1 and...
python C-E please C) Generate 1,000, 000 samples from the random variable X of part B. Estimate the empirical mean o...
 python C-E please
C) Generate 1,000, 000 samples from the random variable X of part B. Estimate the empirical mean of X. Plot the pmf of the samples of X. Now suppose you know that you have already played the wheel a few times (say t 3 times), and you have not won yet. Let's define Y:= X-3 for all X> 3. D) Of the samples generated in part C, keep all the samples greater than t 3 and discard...
python C-E please
C) Generate 1,000, 000 samples from the random variable X of part B. Estimate the empirical mean of X. Plot the pmf of the samples of X. Now suppose you know that you have already played the wheel a few times (say t 3 times), and you have not won yet. Let's define Y:= X-3 for all X> 3. D) Of the samples generated in part C, keep all the samples greater than t 3 and discard...
 Part I: Ene concept of a percentile (equivalently, quantile) is very important in data analysis. It applies to both samples and distributions. So, let's get some wi practice with them, starting with the binomial distribution. In prelab, you learned that the function gbinom(p. size prob) gives the p-th quantile of the binomial distribution with parameters n - size and pi prob. tocus on the binomial distribution with parameters n-10 and pi-0.3.Then, the 38th percentile (or 0.38 quantile) of that distribution...
 please i need to solve 2 and 3 and please explain everything
and write I commend
sing R please, 1. Generate 5,000 iid samples from the standard normal distribution; compute the mean of these random samples. Repeat this process 100 times so you would have stored 100 sample averages. Plot the sample averages using hist() and lines(density() in R. What do you observe? 2. Compute the mean and variance of Binomial distribution with parameters m and p directly from definition...
please i need to solve 2 and 3 and please explain everything
and write I commend
sing R please, 1. Generate 5,000 iid samples from the standard normal distribution; compute the mean of these random samples. Repeat this process 100 times so you would have stored 100 sample averages. Plot the sample averages using hist() and lines(density() in R. What do you observe? 2. Compute the mean and variance of Binomial distribution with parameters m and p directly from definition...
 Part D: 1. Draw 500 random samples of size 8 from a random number generator from a standard normal distribution. Then increase the sample size to 32. Finally, increase the sample size to 128. Plot histograms of the sampling distributions of (i) the sample mean andi) the sample variance, for each of these three sample sizes. Now repeat your experiments for three samples drawn from another parametric distribution of your choice (e.g., a uniform distribution) Discuss the results of your...
 please solve b and c part i)
0,25. For rand population, obta Jon distribution of X and Y. Are 8 and Y Hupunuent? 4+2 (b) Ages of 5 persons have me ons have incan recorded as (in years) 14, 19. 17, 25. For random samples of size 3 drawn without replacement from this ulation, obtain the sampling distribution of sample mean (K). Show at the mean of x equals the population mean and obtain the standard 2+2+2 (c) (i) Form...
please solve b and c part i)
0,25. For rand population, obta Jon distribution of X and Y. Are 8 and Y Hupunuent? 4+2 (b) Ages of 5 persons have me ons have incan recorded as (in years) 14, 19. 17, 25. For random samples of size 3 drawn without replacement from this ulation, obtain the sampling distribution of sample mean (K). Show at the mean of x equals the population mean and obtain the standard 2+2+2 (c) (i) Form...
 Lesson 6.2.4: Binomial Distribution and Sample Proportions A sample proportion, such as the one computed in Question 4, is equal to a number of successes (x), divided by the sample size (n). The notation for a sample proportion is p, and it is computed by the formula p = Each value of x corresponds to a unique sample proportion ( p ), as computed by this formula. For example, x = 1 implies p = + - 0.10. These events,...
 Part Two. Can you help me with the binomial probability
distribution? Please see instructions below.
Please show all steps to understand better. Thank you in
advance.
5. Use the binomial distribution table to find the binomial probabilities for these cases: a) n=10, p=1, k= 3 b) n=14, p = 6, k = 7 c) n =25, p=5, k = 14 6. Consider a binomial experiment with n = 20 and p=0.70. Use the binomial formula to calculate: a) P(x =...
Part Two. Can you help me with the binomial probability
distribution? Please see instructions below.
Please show all steps to understand better. Thank you in
advance.
5. Use the binomial distribution table to find the binomial probabilities for these cases: a) n=10, p=1, k= 3 b) n=14, p = 6, k = 7 c) n =25, p=5, k = 14 6. Consider a binomial experiment with n = 20 and p=0.70. Use the binomial formula to calculate: a) P(x =...
 Help me the part b please, if
possible part c too
The binomial distribution is B(n,pl-probability for variable X to be equal to K P(X-k) with m we define-np, which is the probability of success for n events each with probability p we take the limit when う00 (we consider a very large number of events M-1 2 Mass (Da) 2. Poisson distribution a. Show that the Poisson distribution,p(kl)arises from the binomial distribution in the limit that p 1 and...
Help me the part b please, if
possible part c too
The binomial distribution is B(n,pl-probability for variable X to be equal to K P(X-k) with m we define-np, which is the probability of success for n events each with probability p we take the limit when う00 (we consider a very large number of events M-1 2 Mass (Da) 2. Poisson distribution a. Show that the Poisson distribution,p(kl)arises from the binomial distribution in the limit that p 1 and...
 python C-E please
C) Generate 1,000, 000 samples from the random variable X of part B. Estimate the empirical mean of X. Plot the pmf of the samples of X. Now suppose you know that you have already played the wheel a few times (say t 3 times), and you have not won yet. Let's define Y:= X-3 for all X> 3. D) Of the samples generated in part C, keep all the samples greater than t 3 and discard...
python C-E please
C) Generate 1,000, 000 samples from the random variable X of part B. Estimate the empirical mean of X. Plot the pmf of the samples of X. Now suppose you know that you have already played the wheel a few times (say t 3 times), and you have not won yet. Let's define Y:= X-3 for all X> 3. D) Of the samples generated in part C, keep all the samples greater than t 3 and discard...
Most questions answered within 3 hours.
-
Where is the error in this code sequence?
String s1 = "Hello";
String s2 = "ello";...
asked 10 months ago -
Financial data for Joel de Paris, Inc., for last year
follow:
Joel de Paris, Inc.
Balance...
asked 10 months ago -
Consider this reaction:
Al2(SO4)3 (aq)+ BaCl3
(aq) Al2Cl6 (aq)- +
3BaSO4(s) . What is the...
asked 10 months ago -
Suppose that Savneet is considering increasing her
recent random sample from 20 car rentals to 40...
asked 10 months ago -
Trucks arrive at an unloading terminal at an average rate of 120
per hour.
Trucks arrive...
asked 10 months ago -
Why are methanol and ethanol completely soluble in water while
octanol is not very little soluble....
asked 10 months ago -
A facilities manager at a university reads in a research report
that the mean amount of...
asked 10 months ago -
When the CuSO4 is rehydrated by adding water to the anhydrous
compound, is this an endothermic...
asked 10 months ago -
A ray of sunlight is passing from diamond into crown glass; the
angle of incidence is...
asked 10 months ago -
A block of mass 0.249 kg is placed on top of a light, vertical
spring of...
asked 10 months ago -
how do the kidneys compensate in the presences of acidosis
a) trigger hyperventilate
b) reserve acid...
asked 10 months ago -
Question 501 pts
The rental rate of capital to the firm increases. Which of the
following...
asked 10 months ago