
Homework Answers
The no trade equilibrium will be at the price of $70 and the quantity of 200. And when there is free trade in the economy the price has reduced to $40, here the consumer surplus has increased and the producer surplus has decreased. The consumer surplus is the area below the demand curve and above the price line. The producer surplus is the are above the supply curve and below the price line.
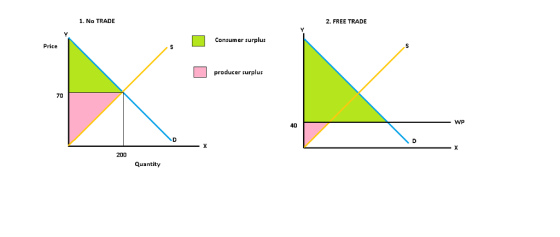
The total surplus is the sum of both the consumer and producer surplus ,
At the no trade position the consumer surplus was
.
At the free trade the consumer surplus is
So the consumer surplus is increased by .
Ans: d). increased by $7500.
Add Answer to:
Not sure how to solve this Questions 1-6: The diagram below depicts the supply and demand...
How do you solve this? QUESTION 6 Questions 1-6: The diagram below depicts the supply and...
 How do you solve this?
QUESTION 6 Questions 1-6: The diagram below depicts the supply and demand curves for bicycles. Use the diagram to answer the following questions 1 to 6. Price S%uait) 150 70 40 Demand 10 100 200 300 Quantity 6. The economy transitions from no trade to free trade and the new international equilibrium price for a bicycle is $40. What is the net welfare impact of the trade liberalization to the economy as a whole? O...
How do you solve this?
QUESTION 6 Questions 1-6: The diagram below depicts the supply and demand curves for bicycles. Use the diagram to answer the following questions 1 to 6. Price S%uait) 150 70 40 Demand 10 100 200 300 Quantity 6. The economy transitions from no trade to free trade and the new international equilibrium price for a bicycle is $40. What is the net welfare impact of the trade liberalization to the economy as a whole? O...
exports/ imports
The diagram below depicts the supply and demand curves for bicycles. Use the diagram to answer the following questions 1 to 6. 3. The economy transitions from no trade to free trade and the new international equilibrium price for a bicycle is $40. Does this economy export or import bicycles? How many? a.Imports 100 bicycles.b.Imports 200 bicycles.c.Exports 100 bicycles.d.Exports 200 bicycles.
I need help solving this question, how do you get the answer? QUESTION 2 Questions 1-6:...
 I need help solving this question, how do you get the
answer?
QUESTION 2 Questions 1-6: The diagram below depicts the supply and demand curves for bicycles. Use the diagram to answer the following questions 1 to 6. Price (5unit 150 Supply LS 120 70 Demand 10 100 200 300 of international trade, what is consumer surplus and producer a. consumer surplus S6,000 producer surplus $8,000 b. consumer surplus = $8,000 ; producer surplus = $6,000 O c, consumer surplus...
I need help solving this question, how do you get the
answer?
QUESTION 2 Questions 1-6: The diagram below depicts the supply and demand curves for bicycles. Use the diagram to answer the following questions 1 to 6. Price (5unit 150 Supply LS 120 70 Demand 10 100 200 300 of international trade, what is consumer surplus and producer a. consumer surplus S6,000 producer surplus $8,000 b. consumer surplus = $8,000 ; producer surplus = $6,000 O c, consumer surplus...
please show work Question 2 (14pt] Autarky and Open Economy In the domestic market for bicycles by Qs 2P-ycles in Isoland, demand is given by p 3000- 10P and supply is given Complete the following...
 please show work
Question 2 (14pt] Autarky and Open Economy In the domestic market for bicycles by Qs 2P-ycles in Isoland, demand is given by p 3000- 10P and supply is given Complete the following table: is given economy is opened to international trade, the world price is $200 per bicycle. Open Economy Autarky Price Quantity Demanded Quantity Supplied Quantity Imported or Exported Consumer Surplus Producer Surplus Deadweight Loss
Question 2 (14pt] Autarky and Open Economy In the domestic market...
please show work
Question 2 (14pt] Autarky and Open Economy In the domestic market for bicycles by Qs 2P-ycles in Isoland, demand is given by p 3000- 10P and supply is given Complete the following table: is given economy is opened to international trade, the world price is $200 per bicycle. Open Economy Autarky Price Quantity Demanded Quantity Supplied Quantity Imported or Exported Consumer Surplus Producer Surplus Deadweight Loss
Question 2 (14pt] Autarky and Open Economy In the domestic market...
Suppose that the graph below depicts demand and supply curves for gasoline. Which graph best represents...
 Suppose that the graph below depicts demand and supply curves for gasoline. Which graph best represents the situation when cost producing gasoline (refining) decreases? Figure 2.1 Supply Curve lethard Supply Curve Irightwand Demand Curve tettwardi Demand Curve ingheward) Price Price Price Price / ty (a) Quantity ibi Quantity a Ob Ос Od
Microeconomics Questions Price of Sandalwood Domestic Supply $800 $600 Domestic Demand Q, Q, Q Quantity of Sandalw...
 Microeconomics Questions
Price of Sandalwood Domestic Supply $800 $600 Domestic Demand Q, Q, Q Quantity of Sandalwood The graph above shows the domestic market for sandalwood in equilibrium at a price of $800 per kilogram in the absence of international trade. Now assume the country begins to engage in international trade, and sandalwood is selling at a price of $600 per kilogram in the world market. Which of the following would most likely result? a) The country would increase domestic...
Microeconomics Questions
Price of Sandalwood Domestic Supply $800 $600 Domestic Demand Q, Q, Q Quantity of Sandalwood The graph above shows the domestic market for sandalwood in equilibrium at a price of $800 per kilogram in the absence of international trade. Now assume the country begins to engage in international trade, and sandalwood is selling at a price of $600 per kilogram in the world market. Which of the following would most likely result? a) The country would increase domestic...
The following diagram shows the domestic demand and domestic supply curves in a market. Suppose the...
 The following diagram shows the domestic demand and domestic
supply curves in a market. Suppose the world price in this market
is $6. Assume the country allows free trade. a. Who does free trade
benefit? Quantify this using consumer or producer surplus. Show
calculations. b. Who does free trade harm? Quantify this using
consumer or producer surplus. Show calculations. c. Overall, does
this benefit or harm society? How do we quantify this - show me.
Interpret the result.
Price 9...
The following diagram shows the domestic demand and domestic
supply curves in a market. Suppose the world price in this market
is $6. Assume the country allows free trade. a. Who does free trade
benefit? Quantify this using consumer or producer surplus. Show
calculations. b. Who does free trade harm? Quantify this using
consumer or producer surplus. Show calculations. c. Overall, does
this benefit or harm society? How do we quantify this - show me.
Interpret the result.
Price 9...
International Trade: End of Chapter Problem 15. The accompanying diagram illustrates the U.S. domestic demand curve...
 International Trade: End of Chapter Problem 15. The accompanying diagram illustrates the U.S. domestic demand curve and domestic supply curve for beef. Price of beef Domestic supply The world price of beef is Pw. The United States currently imposes an import tariff on beef, so the price of beef is PT. Congress decides to eliminate the tariff. In terms of the areas marked in the diagram, answer the following questions. Pili A/BIC:D Domestic demand a. With the elimination of the...
INTERNATIONAL TRADE WORKSHEET 4 Below, you are provided with the demand and supply curves for pizzas....
 INTERNATIONAL TRADE WORKSHEET 4 Below, you are provided with the demand and supply curves for pizzas. You will use this information to identify whether the country imports or exports pizza. You will also determine whether producers and/or consumers win by engaging in international trade. $28 Price $24 $20 Supply $16 $12 Demand $8 $4 1,000 2,000 3,000 4.000 5,000 6,000 Quantity of Pizzas Part 1: Suppose that the country depicted above does not trade pizzas. What is the equilibrium price...
Suppose we have the following market supply and demand schedules for bicycles: 1.1. Plot the supply curve and the de...
Suppose we have the following market supply and demand schedules for bicycles: 1.1. Plot the supply curve and the demand curve for bicycles. 1.2. What is the equilibrium price of bicycles? 1.3. What is the equilibrium quantity of bicycles? 1.4. If the price of bicycles were $100. Is there a surplus or a shortage? How many units of surplus or shortage are there? Will this cause the price to rise or fall? 1.5. Ifthepriceofbicycleswere$400, is there a surplus or a...
 How do you solve this?
QUESTION 6 Questions 1-6: The diagram below depicts the supply and demand curves for bicycles. Use the diagram to answer the following questions 1 to 6. Price S%uait) 150 70 40 Demand 10 100 200 300 Quantity 6. The economy transitions from no trade to free trade and the new international equilibrium price for a bicycle is $40. What is the net welfare impact of the trade liberalization to the economy as a whole? O...
How do you solve this?
QUESTION 6 Questions 1-6: The diagram below depicts the supply and demand curves for bicycles. Use the diagram to answer the following questions 1 to 6. Price S%uait) 150 70 40 Demand 10 100 200 300 Quantity 6. The economy transitions from no trade to free trade and the new international equilibrium price for a bicycle is $40. What is the net welfare impact of the trade liberalization to the economy as a whole? O...
 I need help solving this question, how do you get the
answer?
QUESTION 2 Questions 1-6: The diagram below depicts the supply and demand curves for bicycles. Use the diagram to answer the following questions 1 to 6. Price (5unit 150 Supply LS 120 70 Demand 10 100 200 300 of international trade, what is consumer surplus and producer a. consumer surplus S6,000 producer surplus $8,000 b. consumer surplus = $8,000 ; producer surplus = $6,000 O c, consumer surplus...
I need help solving this question, how do you get the
answer?
QUESTION 2 Questions 1-6: The diagram below depicts the supply and demand curves for bicycles. Use the diagram to answer the following questions 1 to 6. Price (5unit 150 Supply LS 120 70 Demand 10 100 200 300 of international trade, what is consumer surplus and producer a. consumer surplus S6,000 producer surplus $8,000 b. consumer surplus = $8,000 ; producer surplus = $6,000 O c, consumer surplus...
 please show work
Question 2 (14pt] Autarky and Open Economy In the domestic market for bicycles by Qs 2P-ycles in Isoland, demand is given by p 3000- 10P and supply is given Complete the following table: is given economy is opened to international trade, the world price is $200 per bicycle. Open Economy Autarky Price Quantity Demanded Quantity Supplied Quantity Imported or Exported Consumer Surplus Producer Surplus Deadweight Loss
Question 2 (14pt] Autarky and Open Economy In the domestic market...
please show work
Question 2 (14pt] Autarky and Open Economy In the domestic market for bicycles by Qs 2P-ycles in Isoland, demand is given by p 3000- 10P and supply is given Complete the following table: is given economy is opened to international trade, the world price is $200 per bicycle. Open Economy Autarky Price Quantity Demanded Quantity Supplied Quantity Imported or Exported Consumer Surplus Producer Surplus Deadweight Loss
Question 2 (14pt] Autarky and Open Economy In the domestic market...
 Suppose that the graph below depicts demand and supply curves for gasoline. Which graph best represents the situation when cost producing gasoline (refining) decreases? Figure 2.1 Supply Curve lethard Supply Curve Irightwand Demand Curve tettwardi Demand Curve ingheward) Price Price Price Price / ty (a) Quantity ibi Quantity a Ob Ос Od
 Microeconomics Questions
Price of Sandalwood Domestic Supply $800 $600 Domestic Demand Q, Q, Q Quantity of Sandalwood The graph above shows the domestic market for sandalwood in equilibrium at a price of $800 per kilogram in the absence of international trade. Now assume the country begins to engage in international trade, and sandalwood is selling at a price of $600 per kilogram in the world market. Which of the following would most likely result? a) The country would increase domestic...
Microeconomics Questions
Price of Sandalwood Domestic Supply $800 $600 Domestic Demand Q, Q, Q Quantity of Sandalwood The graph above shows the domestic market for sandalwood in equilibrium at a price of $800 per kilogram in the absence of international trade. Now assume the country begins to engage in international trade, and sandalwood is selling at a price of $600 per kilogram in the world market. Which of the following would most likely result? a) The country would increase domestic...
 The following diagram shows the domestic demand and domestic
supply curves in a market. Suppose the world price in this market
is $6. Assume the country allows free trade. a. Who does free trade
benefit? Quantify this using consumer or producer surplus. Show
calculations. b. Who does free trade harm? Quantify this using
consumer or producer surplus. Show calculations. c. Overall, does
this benefit or harm society? How do we quantify this - show me.
Interpret the result.
Price 9...
The following diagram shows the domestic demand and domestic
supply curves in a market. Suppose the world price in this market
is $6. Assume the country allows free trade. a. Who does free trade
benefit? Quantify this using consumer or producer surplus. Show
calculations. b. Who does free trade harm? Quantify this using
consumer or producer surplus. Show calculations. c. Overall, does
this benefit or harm society? How do we quantify this - show me.
Interpret the result.
Price 9...
 International Trade: End of Chapter Problem 15. The accompanying diagram illustrates the U.S. domestic demand curve and domestic supply curve for beef. Price of beef Domestic supply The world price of beef is Pw. The United States currently imposes an import tariff on beef, so the price of beef is PT. Congress decides to eliminate the tariff. In terms of the areas marked in the diagram, answer the following questions. Pili A/BIC:D Domestic demand a. With the elimination of the...
 INTERNATIONAL TRADE WORKSHEET 4 Below, you are provided with the demand and supply curves for pizzas. You will use this information to identify whether the country imports or exports pizza. You will also determine whether producers and/or consumers win by engaging in international trade. $28 Price $24 $20 Supply $16 $12 Demand $8 $4 1,000 2,000 3,000 4.000 5,000 6,000 Quantity of Pizzas Part 1: Suppose that the country depicted above does not trade pizzas. What is the equilibrium price...
Most questions answered within 3 hours.
-
Where is the error in this code sequence?
String s1 = "Hello";
String s2 = "ello";...
asked 10 months ago -
Financial data for Joel de Paris, Inc., for last year
follow:
Joel de Paris, Inc.
Balance...
asked 10 months ago -
Consider this reaction:
Al2(SO4)3 (aq)+ BaCl3
(aq) Al2Cl6 (aq)- +
3BaSO4(s) . What is the...
asked 10 months ago -
Suppose that Savneet is considering increasing her
recent random sample from 20 car rentals to 40...
asked 10 months ago -
Trucks arrive at an unloading terminal at an average rate of 120
per hour.
Trucks arrive...
asked 10 months ago -
Why are methanol and ethanol completely soluble in water while
octanol is not very little soluble....
asked 10 months ago -
A facilities manager at a university reads in a research report
that the mean amount of...
asked 10 months ago -
When the CuSO4 is rehydrated by adding water to the anhydrous
compound, is this an endothermic...
asked 10 months ago -
A ray of sunlight is passing from diamond into crown glass; the
angle of incidence is...
asked 10 months ago -
A block of mass 0.249 kg is placed on top of a light, vertical
spring of...
asked 10 months ago -
how do the kidneys compensate in the presences of acidosis
a) trigger hyperventilate
b) reserve acid...
asked 10 months ago -
Question 501 pts
The rental rate of capital to the firm increases. Which of the
following...
asked 10 months ago