
Homework Answers
1.(a)
R code:
x=c(1.12,0.44,-1.49,0.02,0.81,-1.34,1.34,0.51,-0.12,0.97)
S=sum(x)
M=S/length(x)# Method 1 Q1(a)
M
mean(x)# Method 2 Q1(a)
Output:
> M=S/length(x)# Method 1 Q1(a)
> M
[1] 0.226
> mean(x)# Method 2 Q1(a)
[1] 0.226
1(b)
R code:
x=c(1.12,0.44,-1.49,0.02,0.81,-1.34,1.34,0.51,-0.12,0.97)
S=sum(x)
M=S/length(x)
SS=sum(x^2)
SSW=SS-length(x)*M^2
Var=SSW/(length(x)-1)# Method 1 Q1(b)
Var
var(x)# Method 2 Q1(b)
Output:
> Var
[1] 0.9578267
> var(x)# Method 2 Q1(b)
[1] 0.9578267
1(c)
R code:
sd(x)
Output:
[1] 0.9786862
2.
(a)
R code:
x=rt(1000,2)
quantile(x,0.95)
Output:
> quantile(x,0.95)
95%
2.88103
(b)
R code:
x=rt(1000,2)
quantile(x,0.95)
shapiro.test(x)
Output:
> shapiro.test(x)
Shapiro-Wilk normality test
data: x
W = 0.87789, p-value < 2.2e-16
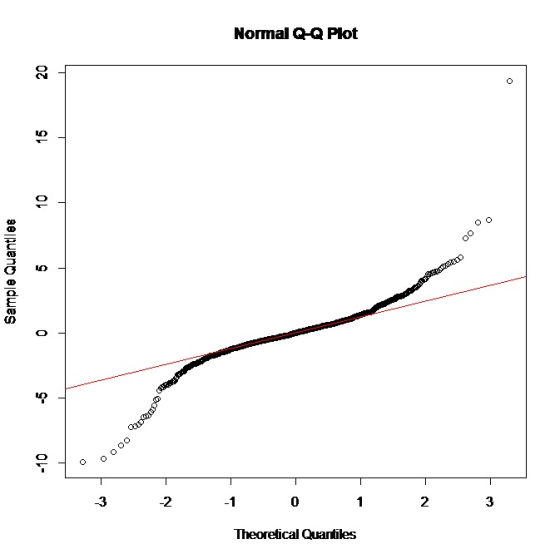
(c)
R code:
x=rt(1000,2)
quantile(x,0.95)
qqnorm(x)
qqline(x, col = 2)
(d)
R code:
x=rt(1000,100)
quantile(x,0.95)
shapiro.test(x)
qqnorm(x)
qqline(x, col = 2)
Output:
> quantile(x,0.95)
95%
1.561231
> shapiro.test(x)
Shapiro-Wilk normality test
data: x
W = 0.99618, p-value = 0.0147

Add Answer to:
What is the code and result in Rstudio or R 1. Suppose we have a random...
Suppose we assume that X1, X2, . . . , Xn is a random sample from...
 Suppose we assume that X1, X2, . . . , Xn is a random sample from a「(1, θ) distribution a) Show that the random variable (2/0) X has a x2 distribution with 2n degrees of freedom. (b) Using the random variable in part (a) as a pivot random variable, find a (1-a) 100% confidence interval for
1. Suppose Yi, ½ . . . , Yn is a random sample of n independent observations from a distribution ...
 1. Suppose Yi, ½ . . . , Yn is a random sample of n independent observations from a distribution with pdf 202 fY()otherwise. (a) Find the MLE for θ (c) Use the pivotal quantity to find a 100(1-a)% CI for θ
1. Suppose Yi, ½ . . . , Yn is a random sample of n independent observations from a distribution with pdf 202 fY()otherwise. (a) Find the MLE for θ (c) Use the pivotal quantity to find a...
1. Suppose Yi, ½ . . . , Yn is a random sample of n independent observations from a distribution with pdf 202 fY()otherwise. (a) Find the MLE for θ (c) Use the pivotal quantity to find a 100(1-a)% CI for θ
1. Suppose Yi, ½ . . . , Yn is a random sample of n independent observations from a distribution with pdf 202 fY()otherwise. (a) Find the MLE for θ (c) Use the pivotal quantity to find a...
Suppose that we wish to generate observations from the discrete distribution 3 a) Suppose that we...
 Suppose that we wish to generate observations from the discrete
distribution
3 a) Suppose that we wish to generate observations from the discrete distribution with probability mass function 2)+1 20 x=1,2, 3, 4, 5 Clearly describe the algorithm to do this and give the random numbers corresponding to the following uniform(0,1) sample. 0.5197 0.1790 0.9994 0.6873 0.7294 0.5791 0.0361 0.2581 0.0026 0.8213 NB: Do not use R for this part of the question. two numbers rolled. Write an R function...
Suppose that we wish to generate observations from the discrete
distribution
3 a) Suppose that we wish to generate observations from the discrete distribution with probability mass function 2)+1 20 x=1,2, 3, 4, 5 Clearly describe the algorithm to do this and give the random numbers corresponding to the following uniform(0,1) sample. 0.5197 0.1790 0.9994 0.6873 0.7294 0.5791 0.0361 0.2581 0.0026 0.8213 NB: Do not use R for this part of the question. two numbers rolled. Write an R function...
11. For a random sample of size 13 from a normal distribution with mean u, you...
 11. For a random sample of size 13 from a normal distribution with mean u, you are given the following regarding the observations: (ti – 1)2 = 77.8 The width of the 100% confidence interval for u is 2.7005. Let tay be the critical value of a t random variable with v degrees of freedom. The following table lists values of tay for specific combinations of a and v: v = 12 v=13 a=0.1 1.356 1.350 a= 0.07 1.580 1.572...
1. Suppose that Xi,..,Xn are independent Exponential random variables with density f(x; λ) λ exp(-1x) for...
 1. Suppose that Xi,..,Xn are independent Exponential random variables with density f(x; λ) λ exp(-1x) for x > 0 where λ > 0 is an unknown parameter (a) Show that the τ quantile of the Exponential distribution is F-1 (r)--X1 In(1-7) and give an approximation to Var(X(k)) for k/n-T. What happens to this variance as τ moves from 0 to 1? (b) The form of the quantile function in part (a) can be used to give a quantile-quantile (QQ) plot...
1- Suppose a simple random sample of sizen is drawn froma large population with mean u...
 1- Suppose a simple random sample of sizen is drawn froma large population with mean u and standard deviation o. The sampling distribution of x has mean ug and standard deviation= 2- As the number of degrees of freedom in the t-distribution increase, the spread of the distribution 3- True or False: The value of to.10 with 5 degrees of freedom is greater than the value of to.10 with 10 degrees of freedom. 4- True or False: To construct a...
Suppose a random sample of 17 is selected from a normal distribution and the sample mean...
Suppose a random sample of 17 is selected from a normal distribution and the sample mean x-bar = 102.5 and the sample standard deviation Sx = 4.3. Is this a z distribution or a t distribution? A. t distribution with 17 degrees of freedom B. t distribution with 16 degrees of freedom C. z distribution D. Cannot be determined Part b construct a 96% confidence interval for the population mean A. 100.17 to 104.83 B. 100.36 to 104.64 C. 100.00...
Solve for 1 and 2: 1) Suppose we were to gather a random sample of 15...
Solve for 1 and 2: 1) Suppose we were to gather a random sample of 15 observations from a population and wished to calculate an 80% confidence interval for the mean, µ, in the case where the population standard deviation, σ, is unknown. Enter the value from the Student's t distribution that we would use, to three decimal places. 2)A random sample of 51 undergraduate statistics students resulted in a sample mean age of 22.1 years, with a sample standard...
Using R programming language, supply the code for: Generate a random sample of size 10, 000...
Using R programming language, supply the code for: Generate a random sample of size 10, 000 from gamma distribution with scale parameter equal to 1 and shape parameter equal to 2, and form it into a 1000 x 10 matrix. Use the apply() function on this matrix to compute the means of the 1000 rows. Note that the resulting vector comprises the mean of 1000 random samples of size 10 from the above distribution. Examine the distribution of the sample...
 Suppose we assume that X1, X2, . . . , Xn is a random sample from a「(1, θ) distribution a) Show that the random variable (2/0) X has a x2 distribution with 2n degrees of freedom. (b) Using the random variable in part (a) as a pivot random variable, find a (1-a) 100% confidence interval for
 1. Suppose Yi, ½ . . . , Yn is a random sample of n independent observations from a distribution with pdf 202 fY()otherwise. (a) Find the MLE for θ (c) Use the pivotal quantity to find a 100(1-a)% CI for θ
1. Suppose Yi, ½ . . . , Yn is a random sample of n independent observations from a distribution with pdf 202 fY()otherwise. (a) Find the MLE for θ (c) Use the pivotal quantity to find a...
1. Suppose Yi, ½ . . . , Yn is a random sample of n independent observations from a distribution with pdf 202 fY()otherwise. (a) Find the MLE for θ (c) Use the pivotal quantity to find a 100(1-a)% CI for θ
1. Suppose Yi, ½ . . . , Yn is a random sample of n independent observations from a distribution with pdf 202 fY()otherwise. (a) Find the MLE for θ (c) Use the pivotal quantity to find a...
 Suppose that we wish to generate observations from the discrete
distribution
3 a) Suppose that we wish to generate observations from the discrete distribution with probability mass function 2)+1 20 x=1,2, 3, 4, 5 Clearly describe the algorithm to do this and give the random numbers corresponding to the following uniform(0,1) sample. 0.5197 0.1790 0.9994 0.6873 0.7294 0.5791 0.0361 0.2581 0.0026 0.8213 NB: Do not use R for this part of the question. two numbers rolled. Write an R function...
Suppose that we wish to generate observations from the discrete
distribution
3 a) Suppose that we wish to generate observations from the discrete distribution with probability mass function 2)+1 20 x=1,2, 3, 4, 5 Clearly describe the algorithm to do this and give the random numbers corresponding to the following uniform(0,1) sample. 0.5197 0.1790 0.9994 0.6873 0.7294 0.5791 0.0361 0.2581 0.0026 0.8213 NB: Do not use R for this part of the question. two numbers rolled. Write an R function...
 11. For a random sample of size 13 from a normal distribution with mean u, you are given the following regarding the observations: (ti – 1)2 = 77.8 The width of the 100% confidence interval for u is 2.7005. Let tay be the critical value of a t random variable with v degrees of freedom. The following table lists values of tay for specific combinations of a and v: v = 12 v=13 a=0.1 1.356 1.350 a= 0.07 1.580 1.572...
 1. Suppose that Xi,..,Xn are independent Exponential random variables with density f(x; λ) λ exp(-1x) for x > 0 where λ > 0 is an unknown parameter (a) Show that the τ quantile of the Exponential distribution is F-1 (r)--X1 In(1-7) and give an approximation to Var(X(k)) for k/n-T. What happens to this variance as τ moves from 0 to 1? (b) The form of the quantile function in part (a) can be used to give a quantile-quantile (QQ) plot...
 1. Suppose that Xi,..,Xn are independent Exponential random variables with density f(x; λ) λ exp(-1x) for x > 0 where λ > 0 is an unknown parameter (a) Show that the τ quantile of the Exponential distribution is F-1 (r)--X1 In(1-7) and give an approximation to Var(X(k)) for k/n-T. What happens to this variance as τ moves from 0 to 1? (b) The form of the quantile function in part (a) can be used to give a quantile-quantile (QQ) plot...
 1- Suppose a simple random sample of sizen is drawn froma large population with mean u and standard deviation o. The sampling distribution of x has mean ug and standard deviation= 2- As the number of degrees of freedom in the t-distribution increase, the spread of the distribution 3- True or False: The value of to.10 with 5 degrees of freedom is greater than the value of to.10 with 10 degrees of freedom. 4- True or False: To construct a...
Most questions answered within 3 hours.
-
Where is the error in this code sequence?
String s1 = "Hello";
String s2 = "ello";...
asked 10 months ago -
Financial data for Joel de Paris, Inc., for last year
follow:
Joel de Paris, Inc.
Balance...
asked 10 months ago -
Consider this reaction:
Al2(SO4)3 (aq)+ BaCl3
(aq) Al2Cl6 (aq)- +
3BaSO4(s) . What is the...
asked 10 months ago -
Suppose that Savneet is considering increasing her
recent random sample from 20 car rentals to 40...
asked 10 months ago -
Trucks arrive at an unloading terminal at an average rate of 120
per hour.
Trucks arrive...
asked 10 months ago -
Why are methanol and ethanol completely soluble in water while
octanol is not very little soluble....
asked 10 months ago -
A facilities manager at a university reads in a research report
that the mean amount of...
asked 10 months ago -
When the CuSO4 is rehydrated by adding water to the anhydrous
compound, is this an endothermic...
asked 10 months ago -
A ray of sunlight is passing from diamond into crown glass; the
angle of incidence is...
asked 10 months ago -
A block of mass 0.249 kg is placed on top of a light, vertical
spring of...
asked 10 months ago -
how do the kidneys compensate in the presences of acidosis
a) trigger hyperventilate
b) reserve acid...
asked 10 months ago -
Question 501 pts
The rental rate of capital to the firm increases. Which of the
following...
asked 10 months ago