

3. A small bag of M&M candies has the following assortment: red (10), blue (2), orange (5), brown (21), green (0), and yellow (18). Let x count the number of candies of each oolor, give the probability distribution for x 4. Find all values of k so that the following is a probability distribution: 1 2 3 4 P(@) 0.15 2k 0.52 k 5. Find the mean and standard deviation of the following probability distribution: 1 3 2 P(E) 0.3 0.2 0.5 =10.25. Find the 6. A probability distribution has a standard deviation equal to 2.5 and r2P(z) mean for this distribution.
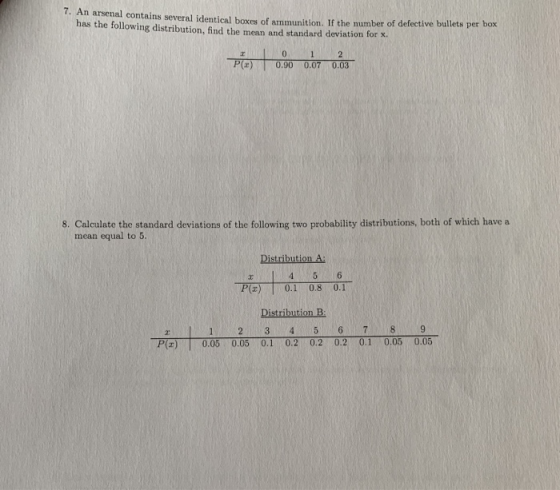
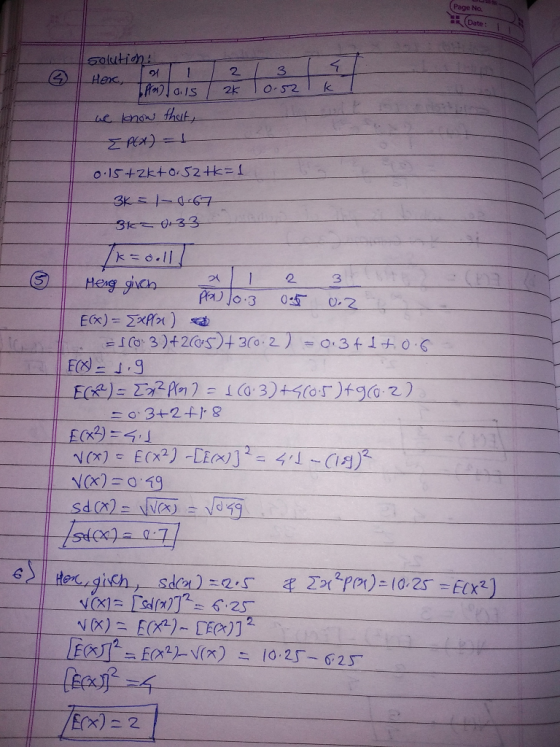
7. An arsenal contains several identical boxes of ammunition, If the number of defective bullets per box has the following distribution, find the mean and standard deviation for x. 2 P(z) 0.90 0.07 0.03 8. Calculate the standard deviations of the following two probability distributions, both of which have a mean equal to 5. Distribution A: 6 4 5 0.8 0.1 0.1 P(r) Distribution B 8 6 7 2 3 4 1 0.1 0.2 0.05 P(r) 0.05 0.2 0.1 0.05 0.2 0.05
Homework Answers
Add Answer to:
Applied and Computational Questions 1. Pairs of random numbers (r, y) a. How many different pairs...
A lab has six computers. Let X denote the number of those computers that are in...
 A lab has six computers. Let X denote the number of those computers that are in use at a particular time of day. Suppose that the probability distribution of X is given in the following table 0 f(x) = P(X=x) 0.05 F(x) = P(XSX) 1 0.1 2 0.15 3 0.25 14 10.2 0.2 S6 5 K 0.1 1. Find k. 2. Find the probability that at least 3 computers are in use. 3. Find the probability that between 2 and...
2) Consider a random variable with the following probability distribution: P(X = 0) = 0.1, P(X=1) =0.2, P(X=2) = 0.3, P(X=3) = 0.3, and P(X=4)= 0.1. A. Generate 400 values of this random variable with...
2) Consider a random variable with the following probability distribution: P(X = 0) = 0.1, P(X=1) =0.2, P(X=2) = 0.3, P(X=3) = 0.3, and P(X=4)= 0.1. A. Generate 400 values of this random variable with the given probability distribution using simulation. B. Compare the distribution of simulated values to the given probability distribution. Is the simulated distribution indicative of the given probability distribution? Explain why or why not. C. Compute the mean and standard deviation of the distribution of simulated...
1. Two independent random variables X and y are given with their distribution laws 4 P 07 0.1 0.2 P 0.2 0.3 0.5 Find 1) the variance of random variable Y 2) the distribution law of random vari...
 1. Two independent random variables X and y are given with their distribution laws 4 P 07 0.1 0.2 P 0.2 0.3 0.5 Find 1) the variance of random variable Y 2) the distribution law of random variable Z-0.5Y+x END TEST IN PROBABL ITY THEORY AND STAISTICS Variant 1 1. Two independent random vanables X and Y are given with their distribution laws: 2 0.7 0.1 P 0.2 0.3 0.5 0.2 Find 1) the variance of random varñable Y 2)...
2) Consider a random variable with the following probability distribution: P(X-0)-0., Px-1)-0.2, PX-2)-0.3, PX-3) -0.3, and PX-4)-0.1 A. Generate 400 values of this random variable with the given pro...
 2) Consider a random variable with the following probability distribution: P(X-0)-0., Px-1)-0.2, PX-2)-0.3, PX-3) -0.3, and PX-4)-0.1 A. Generate 400 values of this random variable with the given probability distribution using simulation. B. Compare the distribution of simulated values to the given probability distribution. Is the simulated distribution indicative of the given probability distribution? Explain why or why not. C. Compute the mean and standard deviation of the distribution of simulated values. How do these summary measures compare to the...
Three tables listed below show random variables and their probabilities. However, only one of these is...
Three tables listed below show random variables and their probabilities. However, only one of these is actually a probability distribution. A B C x P(x) x P(x) x P(x) 25 0.2 25 0.2 25 0.2 50 0.4 50 0.4 50 0.4 75 0.1 75 0.1 75 0.1 100 0.3 100 0.5 100 0.7 a. Which of the above tables is a probability distribution? b. Using the correct probability distribution, find the probability that x is: (Round the final answers to...
Part 2. Random Variables 4. Two independent random variables Xand y are given with their distribution laws 0.3 0.7 0.8...
 Part 2. Random Variables 4. Two independent random variables Xand y are given with their distribution laws 0.3 0.7 0.8 0.2 Pi Find the distribution law and variance for the random variable V-3XY 5. There are 7 white balls and 3 red balls in a box. Balls are taken from the box without return at randomm until one white ball is taken. Construct the distribution law for the number of taken balls. 6. Let X be a continuous random variable...
Please answer the three questions below: 1) 2) 3.) Below is a binomial distribution for n-7...
 Please answer the three questions below:
1)
2)
3.)
Below is a binomial distribution for n-7 and p 0.4. 0.25 0.2 0.15 0.1 0.05 Number of Successes Binomial Distribution Calculate the mean of the binomial distribution. Preview [two decimal accuracy] Below is a binomial distribution for n 6 and p 0.6 0.3 0.25 0.2 S0.15 0.1 0.05 Number of Successes Binomial Distribution Calculate the standard deviation of the binomial distribution. Preview [three decimal accuracy 0.35 0.3 0.25 0.2 0.15 0.1...
Please answer the three questions below:
1)
2)
3.)
Below is a binomial distribution for n-7 and p 0.4. 0.25 0.2 0.15 0.1 0.05 Number of Successes Binomial Distribution Calculate the mean of the binomial distribution. Preview [two decimal accuracy] Below is a binomial distribution for n 6 and p 0.6 0.3 0.25 0.2 S0.15 0.1 0.05 Number of Successes Binomial Distribution Calculate the standard deviation of the binomial distribution. Preview [three decimal accuracy 0.35 0.3 0.25 0.2 0.15 0.1...
Consider three six-sided dice, and let random variable Y = the value of the face for...
Consider three six-sided dice, and let random variable Y = the value of the face for each. The probability mass of function of Y is given by the following table: y 1 2 3 4 5 6 otherwise P(Y=y) 0.35 0.30 0.25 0.05 0.03 0.02 0 Roll the three dice and let random variable X = sum of the three faces. Repeat this experiment 50000 times. Find the simulated probability mass function (pmf) of random variable X. Find the simulated...
Use the probability distribution for the random variable x to answer the question. х 0 1...
 Use the probability distribution for the random variable x to answer the question. х 0 1 2 3 4 5 p(x) 0.3 0.2 0.05 0.15 0.25 0.05 Find u, 02, and o. (Round your standard deviation to two decimal places.) H = 0.2 x 02 = x
Suppose the following data represent the ratings (on a scale from 1 to 5) for a...
 Suppose the following data represent the ratings (on a scale from 1 to 5) for a certain smart phone game, with 1 representing a poor rating. Complete parts (a) through (d) below. Stars 1 2 3 4 5 Frequency 2363 2679 4222 3688 10,166 (a) Construct a discrete probability distribution for the random variable x. Stars (x) P(x) 1 2 3 4 5 (Round to three decimal places as needed.) (b) Graph the discrete probability distribution. Choose the correct graph...
 A lab has six computers. Let X denote the number of those computers that are in use at a particular time of day. Suppose that the probability distribution of X is given in the following table 0 f(x) = P(X=x) 0.05 F(x) = P(XSX) 1 0.1 2 0.15 3 0.25 14 10.2 0.2 S6 5 K 0.1 1. Find k. 2. Find the probability that at least 3 computers are in use. 3. Find the probability that between 2 and...
 1. Two independent random variables X and y are given with their distribution laws 4 P 07 0.1 0.2 P 0.2 0.3 0.5 Find 1) the variance of random variable Y 2) the distribution law of random variable Z-0.5Y+x END TEST IN PROBABL ITY THEORY AND STAISTICS Variant 1 1. Two independent random vanables X and Y are given with their distribution laws: 2 0.7 0.1 P 0.2 0.3 0.5 0.2 Find 1) the variance of random varñable Y 2)...
 2) Consider a random variable with the following probability distribution: P(X-0)-0., Px-1)-0.2, PX-2)-0.3, PX-3) -0.3, and PX-4)-0.1 A. Generate 400 values of this random variable with the given probability distribution using simulation. B. Compare the distribution of simulated values to the given probability distribution. Is the simulated distribution indicative of the given probability distribution? Explain why or why not. C. Compute the mean and standard deviation of the distribution of simulated values. How do these summary measures compare to the...
 Part 2. Random Variables 4. Two independent random variables Xand y are given with their distribution laws 0.3 0.7 0.8 0.2 Pi Find the distribution law and variance for the random variable V-3XY 5. There are 7 white balls and 3 red balls in a box. Balls are taken from the box without return at randomm until one white ball is taken. Construct the distribution law for the number of taken balls. 6. Let X be a continuous random variable...
 Please answer the three questions below:
1)
2)
3.)
Below is a binomial distribution for n-7 and p 0.4. 0.25 0.2 0.15 0.1 0.05 Number of Successes Binomial Distribution Calculate the mean of the binomial distribution. Preview [two decimal accuracy] Below is a binomial distribution for n 6 and p 0.6 0.3 0.25 0.2 S0.15 0.1 0.05 Number of Successes Binomial Distribution Calculate the standard deviation of the binomial distribution. Preview [three decimal accuracy 0.35 0.3 0.25 0.2 0.15 0.1...
Please answer the three questions below:
1)
2)
3.)
Below is a binomial distribution for n-7 and p 0.4. 0.25 0.2 0.15 0.1 0.05 Number of Successes Binomial Distribution Calculate the mean of the binomial distribution. Preview [two decimal accuracy] Below is a binomial distribution for n 6 and p 0.6 0.3 0.25 0.2 S0.15 0.1 0.05 Number of Successes Binomial Distribution Calculate the standard deviation of the binomial distribution. Preview [three decimal accuracy 0.35 0.3 0.25 0.2 0.15 0.1...
 Use the probability distribution for the random variable x to answer the question. х 0 1 2 3 4 5 p(x) 0.3 0.2 0.05 0.15 0.25 0.05 Find u, 02, and o. (Round your standard deviation to two decimal places.) H = 0.2 x 02 = x
 Suppose the following data represent the ratings (on a scale from 1 to 5) for a certain smart phone game, with 1 representing a poor rating. Complete parts (a) through (d) below. Stars 1 2 3 4 5 Frequency 2363 2679 4222 3688 10,166 (a) Construct a discrete probability distribution for the random variable x. Stars (x) P(x) 1 2 3 4 5 (Round to three decimal places as needed.) (b) Graph the discrete probability distribution. Choose the correct graph...
Most questions answered within 3 hours.
-
Where is the error in this code sequence?
String s1 = "Hello";
String s2 = "ello";...
asked 10 months ago -
Financial data for Joel de Paris, Inc., for last year
follow:
Joel de Paris, Inc.
Balance...
asked 10 months ago -
Consider this reaction:
Al2(SO4)3 (aq)+ BaCl3
(aq) Al2Cl6 (aq)- +
3BaSO4(s) . What is the...
asked 10 months ago -
Suppose that Savneet is considering increasing her
recent random sample from 20 car rentals to 40...
asked 10 months ago -
Trucks arrive at an unloading terminal at an average rate of 120
per hour.
Trucks arrive...
asked 10 months ago -
Why are methanol and ethanol completely soluble in water while
octanol is not very little soluble....
asked 10 months ago -
A facilities manager at a university reads in a research report
that the mean amount of...
asked 10 months ago -
When the CuSO4 is rehydrated by adding water to the anhydrous
compound, is this an endothermic...
asked 10 months ago -
A ray of sunlight is passing from diamond into crown glass; the
angle of incidence is...
asked 10 months ago -
A block of mass 0.249 kg is placed on top of a light, vertical
spring of...
asked 10 months ago -
how do the kidneys compensate in the presences of acidosis
a) trigger hyperventilate
b) reserve acid...
asked 10 months ago -
Question 501 pts
The rental rate of capital to the firm increases. Which of the
following...
asked 10 months ago