You will use your Minitab graphs created in Lesson 1 to answer the following questions.
Frequency Histogram Use your frequency histogram to answer the following questions.
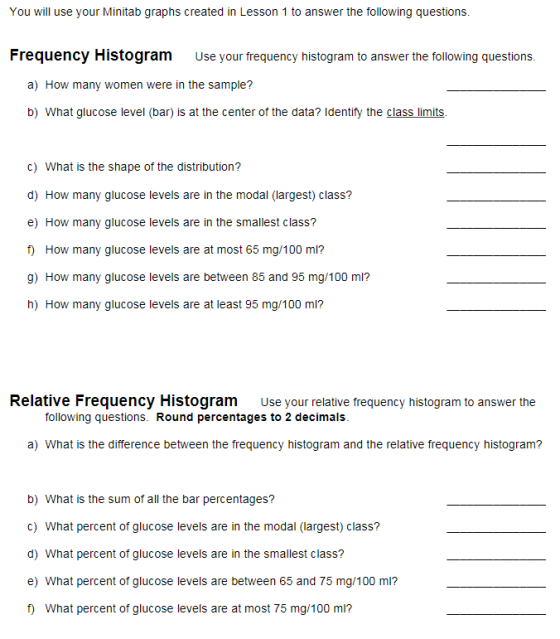
a) How many women were in the sample?
b) What glucose level (bar) is at the center of the data? Identify the class limits.
c) what is the shape of the distribution?
d) How many glucose levels are in the modal (largest) class?
e) How many glucose levels are in the smallest class?
f) How many glucose levels are at most 65 mg/100 ml?
g) How many glucose levels are between 85 and 95 mg/100 ml?
h) How many glucose levels are at least 95 mg/100 ml?
Relative Frequency Histogram
Use your relative frequency histogram to answer the following questions. Round percentages to 2 decimals.
a) what is the difference between the frequency histogram and the relative frequency histogram?
b) What is the sum of all the bar percentages?
c) What percent of glucose levels are in the modal (largest) class?
d) What percent of glucose levels are in the smallest class?
e) What percent of glucose levels are between 65 and 75 mg/100 ml?
f) What percent of glucose levels are at most 75 mg/100 mi?
g What percent of glucose levels are at least 95 mg/100 ml?


Homework Answers
Frequency Histogram
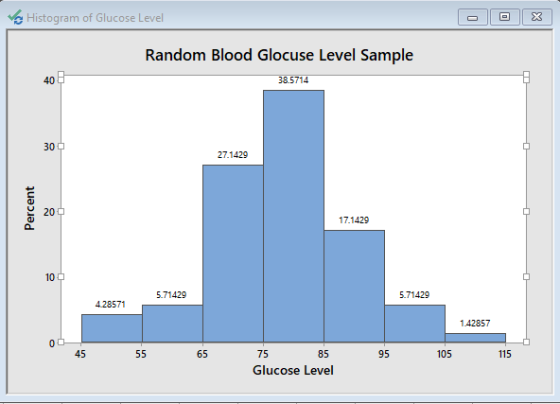
a) How many women were in the sample? Solution: N= (=3+0+0+2+6+10+11+14+12+3+5+3+0+1)= 70 or N=3+4+19+27+12+4+1=70
b) What glucose level(bar) is at the center of the data? Identify the class limits. Solution: Glucose level= 80 [ (75+85)/2 ]
Class limits: 75-85 ( From graph 1 or 2 )
c) What is the shape of the distribution? Solution: Normal Distribution. ( Bell-shaped curve)
d) How many glucose levels are there in the modal class(largest class)? Solution: Number of women with glucose levels in Modal class i.e the class which has the highest frequency i.e 27 Class: 75-85 ( ( From graph 2 )
e) How many glucose levels are there in the smallest class? Solution : 1 Class : 105-115 ( From graph 2 )
f) How many glucose levels are at most 65mg/100ml? Solution : Glucose levels are at most 65mg/100ml mean Women havingGlucose levels less than or equal to 65mg =3+4 =7 ( From graph 2 )
g) How many glucose levels are between 85 and 95 mg/100ml? Solution: 12 ( From graph 2 )
h) How many glucose levels are at least 95mg/100ml? Solution: Women with Glucose levels greater than or equal to 95mg/100ml = 4+1=5 ( From graph 2 )
Relative Frequency Histogram :
a) Difference between Frequency Histogram and Relative Frequency Histogram
| Frequency Histogram | Relative Frequency Histogram |
|---|---|
| Uses simple frequency or number of observations | Uses relative frequency or proportional frequency i.e Frequency of each class interval / Total Frequency |
| Horizontal axis: X-axis: Count of observations | Horizontal axis: X-axis: Percentage of observations |
b) What is the sum of all the bar percentages? Solution: Sum is always 100%
c) How many glucose levels are there in the modal class(largest class)? Solution: Number of women with glucose levels in Modal class i.e the class which has the highest frequency i.e 27 Class: 75-85 ( ( From graph 2 )
d) How many glucose levels are there in the smallest class? Solution : 1 Class : 105-115 ( From graph 2 )
e) How many glucose levels are at most 65mg/100ml? Solution: Glucose levels are at most 65mg/100ml mean Women having glucose levels less than or equal to 65mg =3+4 =7 ( From graph 2 )
f) How many glucose levels are between 85 and 95 mg/100ml? Solution: 12 ( From graph 2 )
g) How many glucose levels are at least 95mg/100ml? Solution: Women with Glucose levels greater than or equal to 95mg/100ml = 4+1=5 (From graph 2 )
Add Answer to:
You will use your Minitab graphs created in Lesson 1 to answer the following questions.
Please answer all questions! thanks :) VI/ Test scores from a math midterm are as follows:...
 Please
answer all questions! thanks :)
VI/ Test scores from a math midterm are as follows: 79, 90, 85, 89, 70, 59, 75, 64, 83, 78, 75, 77, 78, 77, 67, 85, 74, 52, 87, 72, 69, 76, 61, 77, 93, 86, 79, 90, 74, 67, 51, 75, 77, 82, 78, 60, 86, 72, 91, 95, 82 Complete the frequency distribution table to include all data a. Class Tallies Class Midpoint Relative Cumulative Frequency relative freq boundaries Frequency 51 57...
Please
answer all questions! thanks :)
VI/ Test scores from a math midterm are as follows: 79, 90, 85, 89, 70, 59, 75, 64, 83, 78, 75, 77, 78, 77, 67, 85, 74, 52, 87, 72, 69, 76, 61, 77, 93, 86, 79, 90, 74, 67, 51, 75, 77, 82, 78, 60, 86, 72, 91, 95, 82 Complete the frequency distribution table to include all data a. Class Tallies Class Midpoint Relative Cumulative Frequency relative freq boundaries Frequency 51 57...
The following data represent glucose blood levels (mg/100 ml) after a 12-hour fast for a random...
 The following data represent glucose blood levels (mg/100 ml) after a 12-hour fast for a random sample of 70 women (Reference American Journal of Clinical Nutrition, Vol. 19, pp. 345-351) 45 668) 71 75 64 59 59 75 82 B0 81 85 77 82 90 87 72 70 69 83 71 87 69 81 76 96 83 67 94 101 94 89 94 73 99 93 85 83 90 78 80 85 83 84 74 81 70 65 89 70...
In exercises 43 and 44, use the data set and the indicated number of classes to...
In exercises 43 and 44, use the data set and the indicated number of classes to construct (a) an expanded frequency distribution, (b) a frequency histogram, (c) a frequency polygon, (d) a relative frequency histogram, and (e) an ogive. 43. Pulse Rates Number of classes: 6 Data set: Pulse rates all students in a class 68 105 95 80 90 100 75 70 84 98 102 70 65 88 90 75 78 94 110 120 95 80 76 108 44....
7. Use the following collection of 30 test scores: 100, 65, 67, 61, 62, 70, 75,...
 7. Use the following collection of 30 test scores: 100, 65, 67, 61, 62, 70, 75, 73, 88, 77, 83, 79, 95, 79, 80, 102, 86, 87, 87, 91, 87, 89, 92, 90, 99, 87, 72, 93, 79,52 a. Construct a frequency distribution table using 6 classes: include classes, frequencies, class marks, class boundaries, relative frequencies and relative percentages. b. Find the mean to the nearest tenth and sample standard deviation to the nearest tenth. c. Use the results from...
Suppose that a polling company surveyed 600 people about how much time they spend using the...
 Suppose that a polling company surveyed 600 people about how much time they spend using the Internet each week. The results of this survey were compiled and used to create this relative frequency histogram. 30 20 10 12 16 20 24 28 32 36 Weekly hours of internet use Assume that all percentages shown in the histogram are whole numbers. Each of the bars in this histogram includes only the left endpoint of the class except for the last bar,...
4) Use the following data to: a. Fill in the frequency table (15 points) b. Find...
 4) Use the following data to: a. Fill in the frequency table (15 points) b. Find the relative frequency of each class, rounded to two decimal points (15 points) c. Create an appropriate frequency histogram on the graph provided. (10 points) 70 67 88 93 100 72 8 90 85 91 62 75 8780 81 55 60 63 95 81 Class |Frequency |Rel. Freq 51 - 60 61-70 71-80 81-90 91-100 51-60 61-70 71-80 81-90 91-100 Class
show work 7. Use the following collection of 30 test scores: 100, 65, 67, 61, 62,...
 show work
7. Use the following collection of 30 test scores: 100, 65, 67, 61, 62, 70, 75, 73, 88, 77, 83, 79, 95, 79, 80, 102, 86, 87, 87, 91, 87, 89, 92, 90, 99, 87, 72, 93, 79, 52 a. Construct a frequency distribution table using 6 classes: include classes, frequencies, class marks, class boundaries, relative frequencies and relative percentages. b. Find the mean to the nearest tenth and sample standard deviation to the nearest tenth. 6. Use...
show work
7. Use the following collection of 30 test scores: 100, 65, 67, 61, 62, 70, 75, 73, 88, 77, 83, 79, 95, 79, 80, 102, 86, 87, 87, 91, 87, 89, 92, 90, 99, 87, 72, 93, 79, 52 a. Construct a frequency distribution table using 6 classes: include classes, frequencies, class marks, class boundaries, relative frequencies and relative percentages. b. Find the mean to the nearest tenth and sample standard deviation to the nearest tenth. 6. Use...
or questions 18-23, use the following information: rder acetaminophen 10-15 mg/eg/dose PO every 4 hild weighs...
 or questions 18-23, use the following information: rder acetaminophen 10-15 mg/eg/dose PO every 4 hild weighs 55 pounds He -6 hours PRN for pain or fever 8. How many kilograms does the child weight? 25 kg 9. What is the smallest dose in mg that the child should receive at each dose? 250 mg 20. What is largest safest dose in mg the child may receive at each dose? 375 mg 21. What is the maximum dosage the child could...
2. Use the graph to estimate the percentage of the 812 who reported a high(100 points...
 2. Use the graph to estimate the percentage of the 812 who
reported a high(100 points or greater) level of support for
corporate sustainbility
A study was performed on the sustainability behaviors of corporations. Corporate sustainability refers to business practices designed around social and environmental considerations. Data on the level of support for corporate sustainability were obtained for 812 senior managers. Level of support was measured quantitatively. Simulation was used to convert the data to a scale ranging from 0...
2. Use the graph to estimate the percentage of the 812 who
reported a high(100 points or greater) level of support for
corporate sustainbility
A study was performed on the sustainability behaviors of corporations. Corporate sustainability refers to business practices designed around social and environmental considerations. Data on the level of support for corporate sustainability were obtained for 812 senior managers. Level of support was measured quantitatively. Simulation was used to convert the data to a scale ranging from 0...
 Please
answer all questions! thanks :)
VI/ Test scores from a math midterm are as follows: 79, 90, 85, 89, 70, 59, 75, 64, 83, 78, 75, 77, 78, 77, 67, 85, 74, 52, 87, 72, 69, 76, 61, 77, 93, 86, 79, 90, 74, 67, 51, 75, 77, 82, 78, 60, 86, 72, 91, 95, 82 Complete the frequency distribution table to include all data a. Class Tallies Class Midpoint Relative Cumulative Frequency relative freq boundaries Frequency 51 57...
Please
answer all questions! thanks :)
VI/ Test scores from a math midterm are as follows: 79, 90, 85, 89, 70, 59, 75, 64, 83, 78, 75, 77, 78, 77, 67, 85, 74, 52, 87, 72, 69, 76, 61, 77, 93, 86, 79, 90, 74, 67, 51, 75, 77, 82, 78, 60, 86, 72, 91, 95, 82 Complete the frequency distribution table to include all data a. Class Tallies Class Midpoint Relative Cumulative Frequency relative freq boundaries Frequency 51 57...
 The following data represent glucose blood levels (mg/100 ml) after a 12-hour fast for a random sample of 70 women (Reference American Journal of Clinical Nutrition, Vol. 19, pp. 345-351) 45 668) 71 75 64 59 59 75 82 B0 81 85 77 82 90 87 72 70 69 83 71 87 69 81 76 96 83 67 94 101 94 89 94 73 99 93 85 83 90 78 80 85 83 84 74 81 70 65 89 70...
 7. Use the following collection of 30 test scores: 100, 65, 67, 61, 62, 70, 75, 73, 88, 77, 83, 79, 95, 79, 80, 102, 86, 87, 87, 91, 87, 89, 92, 90, 99, 87, 72, 93, 79,52 a. Construct a frequency distribution table using 6 classes: include classes, frequencies, class marks, class boundaries, relative frequencies and relative percentages. b. Find the mean to the nearest tenth and sample standard deviation to the nearest tenth. c. Use the results from...
 7. Use the following collection of 30 test scores: 100, 65, 67, 61, 62, 70, 75, 73, 88, 77, 83, 79, 95, 79, 80, 102, 86, 87, 87, 91, 87, 89, 92, 90, 99, 87, 72, 93, 79,52 a. Construct a frequency distribution table using 6 classes: include classes, frequencies, class marks, class boundaries, relative frequencies and relative percentages. b. Find the mean to the nearest tenth and sample standard deviation to the nearest tenth. c. Use the results from...
 Suppose that a polling company surveyed 600 people about how much time they spend using the Internet each week. The results of this survey were compiled and used to create this relative frequency histogram. 30 20 10 12 16 20 24 28 32 36 Weekly hours of internet use Assume that all percentages shown in the histogram are whole numbers. Each of the bars in this histogram includes only the left endpoint of the class except for the last bar,...
 4) Use the following data to: a. Fill in the frequency table (15 points) b. Find the relative frequency of each class, rounded to two decimal points (15 points) c. Create an appropriate frequency histogram on the graph provided. (10 points) 70 67 88 93 100 72 8 90 85 91 62 75 8780 81 55 60 63 95 81 Class |Frequency |Rel. Freq 51 - 60 61-70 71-80 81-90 91-100 51-60 61-70 71-80 81-90 91-100 Class
 show work
7. Use the following collection of 30 test scores: 100, 65, 67, 61, 62, 70, 75, 73, 88, 77, 83, 79, 95, 79, 80, 102, 86, 87, 87, 91, 87, 89, 92, 90, 99, 87, 72, 93, 79, 52 a. Construct a frequency distribution table using 6 classes: include classes, frequencies, class marks, class boundaries, relative frequencies and relative percentages. b. Find the mean to the nearest tenth and sample standard deviation to the nearest tenth. 6. Use...
show work
7. Use the following collection of 30 test scores: 100, 65, 67, 61, 62, 70, 75, 73, 88, 77, 83, 79, 95, 79, 80, 102, 86, 87, 87, 91, 87, 89, 92, 90, 99, 87, 72, 93, 79, 52 a. Construct a frequency distribution table using 6 classes: include classes, frequencies, class marks, class boundaries, relative frequencies and relative percentages. b. Find the mean to the nearest tenth and sample standard deviation to the nearest tenth. 6. Use...
 or questions 18-23, use the following information: rder acetaminophen 10-15 mg/eg/dose PO every 4 hild weighs 55 pounds He -6 hours PRN for pain or fever 8. How many kilograms does the child weight? 25 kg 9. What is the smallest dose in mg that the child should receive at each dose? 250 mg 20. What is largest safest dose in mg the child may receive at each dose? 375 mg 21. What is the maximum dosage the child could...
 2. Use the graph to estimate the percentage of the 812 who
reported a high(100 points or greater) level of support for
corporate sustainbility
A study was performed on the sustainability behaviors of corporations. Corporate sustainability refers to business practices designed around social and environmental considerations. Data on the level of support for corporate sustainability were obtained for 812 senior managers. Level of support was measured quantitatively. Simulation was used to convert the data to a scale ranging from 0...
2. Use the graph to estimate the percentage of the 812 who
reported a high(100 points or greater) level of support for
corporate sustainbility
A study was performed on the sustainability behaviors of corporations. Corporate sustainability refers to business practices designed around social and environmental considerations. Data on the level of support for corporate sustainability were obtained for 812 senior managers. Level of support was measured quantitatively. Simulation was used to convert the data to a scale ranging from 0...
Most questions answered within 3 hours.
-
Where is the error in this code sequence?
String s1 = "Hello";
String s2 = "ello";...
asked 11 months ago -
Financial data for Joel de Paris, Inc., for last year
follow:
Joel de Paris, Inc.
Balance...
asked 11 months ago -
Consider this reaction:
Al2(SO4)3 (aq)+ BaCl3
(aq) Al2Cl6 (aq)- +
3BaSO4(s) . What is the...
asked 11 months ago -
Suppose that Savneet is considering increasing her
recent random sample from 20 car rentals to 40...
asked 11 months ago -
Trucks arrive at an unloading terminal at an average rate of 120
per hour.
Trucks arrive...
asked 11 months ago -
Why are methanol and ethanol completely soluble in water while
octanol is not very little soluble....
asked 11 months ago -
A facilities manager at a university reads in a research report
that the mean amount of...
asked 11 months ago -
When the CuSO4 is rehydrated by adding water to the anhydrous
compound, is this an endothermic...
asked 11 months ago -
A ray of sunlight is passing from diamond into crown glass; the
angle of incidence is...
asked 11 months ago -
A block of mass 0.249 kg is placed on top of a light, vertical
spring of...
asked 11 months ago -
how do the kidneys compensate in the presences of acidosis
a) trigger hyperventilate
b) reserve acid...
asked 11 months ago -
Question 501 pts
The rental rate of capital to the firm increases. Which of the
following...
asked 11 months ago