how did they come up with 12 for the test value? We want to test that,...
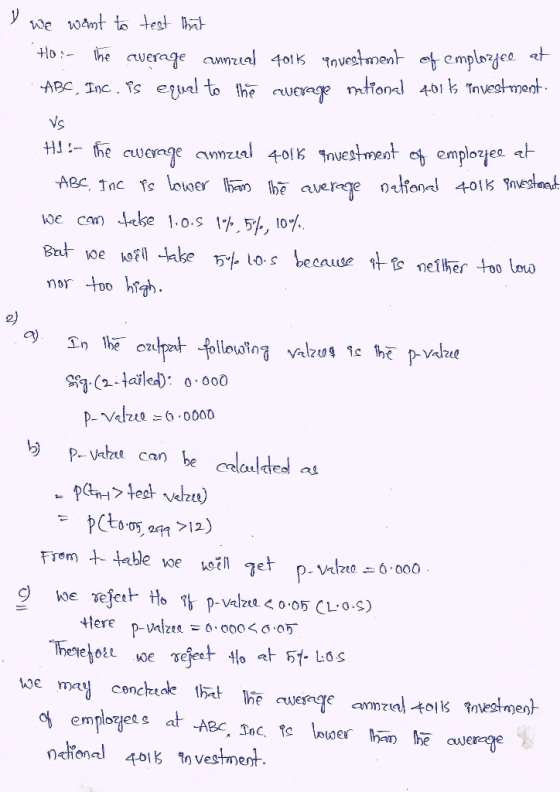
how did they come up with 12 for the test value? We want to test that, Ho:- The average annual 401k investment of employees at ABC, Inc. is equal to the average national 401k investment. Vs H1:- The average annual 401k investment of employees at ABC, Inc. is lower than the average national 401k investment. We can take l.o.s 1%,5%.,10%. But we will take 5% l.o.s. because it is neither too low nor too high. 2) a) In the output following value is the P value Sig. (2-tailed): .000 P value = 0.0000 b) P value can be calculated as : P(tn-1 > test value) =P( t0.05,299 > 12) From t table we will get PValue = 0.000 c) We reject Ho if P value < 0.05(L.o.s.) Here P value = 0.000 < 0.05 Therefore We reject Ho.at 5% L.o.s. We may conclude that the average annual 401k investment of employees at ABC, Inc. is lower than the average national 401k investment home / study / math / statistics and probability / statistics and probability questions and answers / employees in your organization have continually expressed interest in learning more about financial ... Question: Employees in your organization have continually expressed interest in learning more about financi... (1 bookmark) Employees in your organization have continually expressed interest in learning more about financial planning for retirement. In response to these requests, your organization’s executive leadership team has asked you to participate in an initiative to help educate employees. Given your experience with research and statistics, you have been asked to research current trends in 401k investments to help inform the initiative. According to your research findings, the average national 401k investment is 12%. For the purpose of this initiative, your goal is to determine how the 401k contributions of the employees in your organization compare to the national average. To accomplish this, you gather information from a single sample of employees (N = 300) in your organization to determine an average annual 401k investment. For this assignment, you will perform statistical hypothesis testing on a single sample of employees in your organization to determine how they compare to the national average. Use the following research hypothesis to guide your efforts: what is H0? ____________ H1: The average annual 401k investment of employees at ABC, Inc. is lower than the average national 401k investment. Assume the following: 1. The sample of annual 401k investment percentages from ABC, Inc. employees was randomly selected. 2. The variable, average annual 401k investment percentage, is measured at the interval-ratio level. 3. The sampling distribution of the mean will be approximately normal (N = 300). Complete each of the sections below. 1) State the Null Hypothesis and Select Alpha: (0.05? why? justify 0.05) __________________ One-Sample Statistics N = 300 Mean: 10.47 Std. Deviation: 5.912 Std. Error Mean: .341 One-Sample Test Test Value = 12 t: -4.480 df: 299 Sig. (2-tailed): .000 Mean Difference: -1.529 95% Confidence Interval of the Difference Lower: -2.2 Upper: -0.86
Homework Answers
Add Answer to:
how did they come up with 12 for the test value? We want to test that,...
a) Compute the value of the test statistic (z-value of the sample mean). (Round to 4...
 a) Compute the value of the test statistic (z-value of the
sample mean). (Round to 4 decimal points)
b) What is the p-value? Round to 4 decimal points.
c) What is the hypotheses for this application?
Question 1 2 pts The mean hourly wage for employees in goods-producing industries is currently $24.57 (Bureau of Labor Statistics website, April, 12, 2012). Suppose we take a sample of employees from the manufacturing industry to see if the mean hourly wage differs from...
a) Compute the value of the test statistic (z-value of the
sample mean). (Round to 4 decimal points)
b) What is the p-value? Round to 4 decimal points.
c) What is the hypotheses for this application?
Question 1 2 pts The mean hourly wage for employees in goods-producing industries is currently $24.57 (Bureau of Labor Statistics website, April, 12, 2012). Suppose we take a sample of employees from the manufacturing industry to see if the mean hourly wage differs from...
A one-sample t-test was conducted to test whether King County had greater home values compared to...
A one-sample t-test was conducted to test whether King County had greater home values compared to the national average. Findings suggest that the $610,000 average home price in King County (SD=$123,610) is greater than the national average of $478,010, t(5,671)=2.45, p<.001." Using this results section, answer the questions below. 1. What is a good research hypothesis for this results section? There is no difference in housing costs between King County and the national average. Housing costs in King County are...
6. We want to test whether there is an equal ratio of freshman to sophomores to...
 6. We want to test whether there is an equal ratio of freshman to sophomores to juniors to seniors at UC Davis. I perform a Goodness of Fittest and to reject the null hypothesis then a. the sample distribution was extremely uneven across dasses b. we conclude that the ratio in the null hypothesis is plausible c. we know the test statistic was larger than the critical value d. we know the degrees of freedom for the test was 7....
Suppose that we want to test the hypothesis that mothers with low socioeconomic status (SES) deliver babies whose birthweights are different than "normal"
Parts a) and c) are correct, please answer b) and d) (the answers selected may or may not be correct).Suppose that we want to test the hypothesis that mothers with low socioeconomic status (SES) deliver babies whose birthweights are different than "normal". To test this hypothesis, a list of birthweights from 92 consecutive, full-term, live-born deliveries from the maternity ward of a hospital in a low-SES area is obtained. The mean birghweight is found to be 116 oz with a...
2. Suppose we want to test whether a coin is fair (that is, the probability of...
 2. Suppose we want to test whether a coin is fair (that is, the probability of heads is p = .5). We toss the coin 1000 times, and record the number of heads. Let T denote the number of heads divided by 1000. Consider a test that rejects the null hypothesis that p=.5 if T > c. (a) Write down a formula for P(T>c) assuming p = 0.5. (This formula may be compli- cated, but try to give an explicit...
15) Find the critical value that defines the rejection region for the following hypothesis test: Is...
 15) Find the critical value that defines the rejection region for the following hypothesis test: Is the average life expectancy of Americans more than 78.8 years? To test this claim, a sample of 400 Americans are studied, with an average lifespan of 79.4 years and a standard deviation of 3.9 years. Use a significance level of 0.05. A) 1.649 B) 1.645 C) 3.08 D) -1.649 E) None of the Above 16) A large software company gives job applicants a test...
A report states that the mean yearly salary offer for students graduating with a degree in...
A report states that the mean yearly salary offer for students graduating with a degree in accounting is $48,752. Suppose that a random sample of 50 accounting graduates at a large university who received job offers resulted in a mean offer of $49,890 and a standard deviation of $3300. Do the sample data provide strong support for the claim that the mean salary offer for accounting graduates of this university is higher than the national average of $48,752? Test the...
QUESTION 7 Question 7-9 are based on the following information: The mean annual premium for automobile...
QUESTION 7 Question 7-9 are based on the following information: The mean annual premium for automobile insurance in the United States is $1503 (Insure.com website, March 6, 2014). Being from Pennsylvania, you believe automobile insurance is cheaper there and wish to develop statistical support for your opinion. A sample of 25 automobile insurance policies from the state of Pennsylvania showed a mean annual premium of $1440 with a standard deviation of s = $165. If required, enter negative values as...
The average annual miles driven per vehicle in the United States is 11.1 thousand miles, with...
The average annual miles driven per vehicle in the United States is 11.1 thousand miles, with σ ≈ 600 miles. Suppose that a random sample of 41 vehicles owned by residents of Chicago showed that the average mileage driven last year was 10.9 thousand miles. Does this indicate that the average miles driven per vehicle in Chicago is different from (higher or lower than) the national average? Use a 0.05 level of significance. What are we testing in this problem?...
 a) Compute the value of the test statistic (z-value of the
sample mean). (Round to 4 decimal points)
b) What is the p-value? Round to 4 decimal points.
c) What is the hypotheses for this application?
Question 1 2 pts The mean hourly wage for employees in goods-producing industries is currently $24.57 (Bureau of Labor Statistics website, April, 12, 2012). Suppose we take a sample of employees from the manufacturing industry to see if the mean hourly wage differs from...
a) Compute the value of the test statistic (z-value of the
sample mean). (Round to 4 decimal points)
b) What is the p-value? Round to 4 decimal points.
c) What is the hypotheses for this application?
Question 1 2 pts The mean hourly wage for employees in goods-producing industries is currently $24.57 (Bureau of Labor Statistics website, April, 12, 2012). Suppose we take a sample of employees from the manufacturing industry to see if the mean hourly wage differs from...
 6. We want to test whether there is an equal ratio of freshman to sophomores to juniors to seniors at UC Davis. I perform a Goodness of Fittest and to reject the null hypothesis then a. the sample distribution was extremely uneven across dasses b. we conclude that the ratio in the null hypothesis is plausible c. we know the test statistic was larger than the critical value d. we know the degrees of freedom for the test was 7....
 2. Suppose we want to test whether a coin is fair (that is, the probability of heads is p = .5). We toss the coin 1000 times, and record the number of heads. Let T denote the number of heads divided by 1000. Consider a test that rejects the null hypothesis that p=.5 if T > c. (a) Write down a formula for P(T>c) assuming p = 0.5. (This formula may be compli- cated, but try to give an explicit...
 15) Find the critical value that defines the rejection region for the following hypothesis test: Is the average life expectancy of Americans more than 78.8 years? To test this claim, a sample of 400 Americans are studied, with an average lifespan of 79.4 years and a standard deviation of 3.9 years. Use a significance level of 0.05. A) 1.649 B) 1.645 C) 3.08 D) -1.649 E) None of the Above 16) A large software company gives job applicants a test...
 15) Find the critical value that defines the rejection region for the following hypothesis test: Is the average life expectancy of Americans more than 78.8 years? To test this claim, a sample of 400 Americans are studied, with an average lifespan of 79.4 years and a standard deviation of 3.9 years. Use a significance level of 0.05. A) 1.649 B) 1.645 C) 3.08 D) -1.649 E) None of the Above 16) A large software company gives job applicants a test...
Most questions answered within 3 hours.
-
Where is the error in this code sequence?
String s1 = "Hello";
String s2 = "ello";...
asked 10 months ago -
Financial data for Joel de Paris, Inc., for last year
follow:
Joel de Paris, Inc.
Balance...
asked 10 months ago -
Consider this reaction:
Al2(SO4)3 (aq)+ BaCl3
(aq) Al2Cl6 (aq)- +
3BaSO4(s) . What is the...
asked 10 months ago -
Suppose that Savneet is considering increasing her
recent random sample from 20 car rentals to 40...
asked 10 months ago -
Trucks arrive at an unloading terminal at an average rate of 120
per hour.
Trucks arrive...
asked 10 months ago -
Why are methanol and ethanol completely soluble in water while
octanol is not very little soluble....
asked 10 months ago -
A facilities manager at a university reads in a research report
that the mean amount of...
asked 10 months ago -
When the CuSO4 is rehydrated by adding water to the anhydrous
compound, is this an endothermic...
asked 10 months ago -
A ray of sunlight is passing from diamond into crown glass; the
angle of incidence is...
asked 10 months ago -
A block of mass 0.249 kg is placed on top of a light, vertical
spring of...
asked 10 months ago -
how do the kidneys compensate in the presences of acidosis
a) trigger hyperventilate
b) reserve acid...
asked 10 months ago -
Question 501 pts
The rental rate of capital to the firm increases. Which of the
following...
asked 10 months ago