

Homework Answers
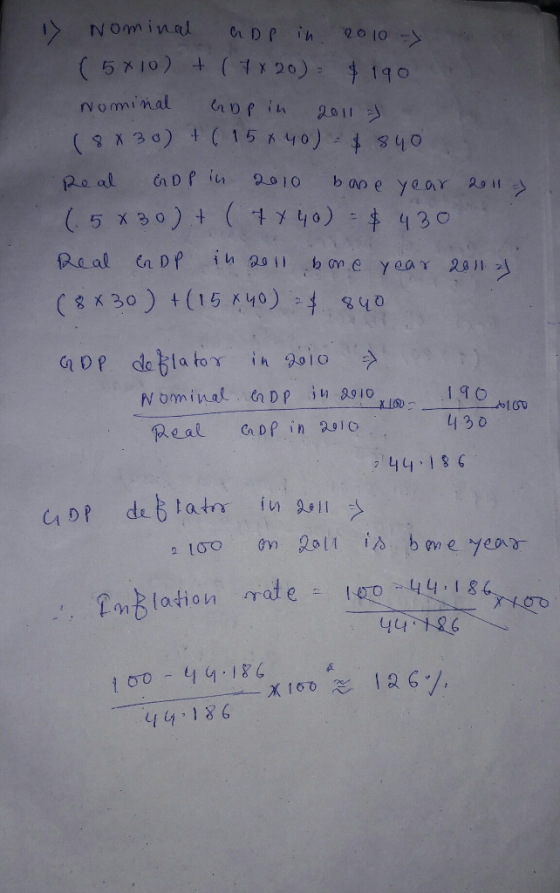
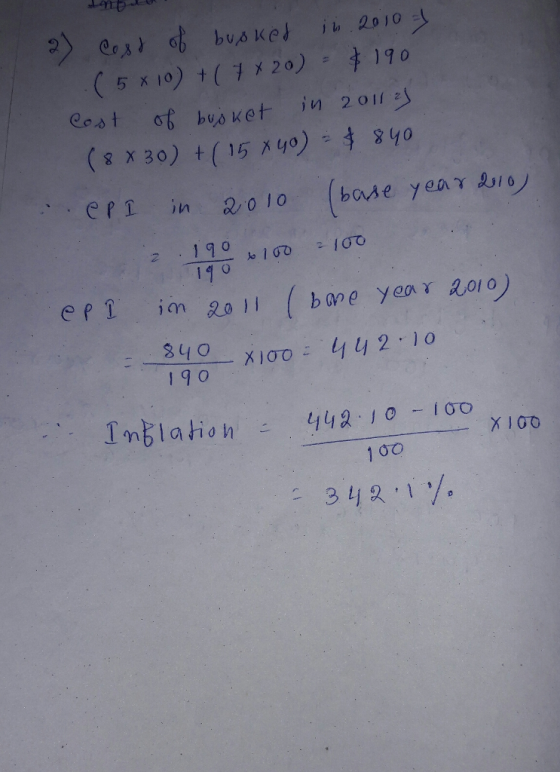
Gdp deflator=(nominal GDP/real GDP)*100. CPI=(cost of the basket in the current year/cost of the basket in base year)*100
Add Answer to:
Suppose the following economy produced pencils and erasers in 2011 and 2012 according to the following...
Suppose the following economy produced pencils and erasers in 2011 and 2012 according to the following...
 Suppose the following economy produced pencils and erasers in 2011 and 2012 according to the following table. CPl basket in this economy consists of 5 pencils and 7 erasers. Which one is the value nearest to an inflation rate by CPI between 2010 and 2011 using 2010 as a base year? Q2010 P2010 02011 P2011 Pencils 5 10 8 30 Erasers 7 20 15 40 Select one: a. 135 O b. 100 O c. 115 d. 125
Suppose the following economy produced pencils and erasers in 2010 and 2011 according to the following...
 Suppose the following economy produced pencils and erasers in 2010 and 2011 according to the following table. CPI basket in this economy consists of 5 pencils and 7 erasers. Which one is the value nearest to an inflation rate by CPI between 2010 and 2011 using 2010 as a base year? 2010 2010 2011 2011 Pencils 5 10 8 30 Erasers 7 20 15 40 Select one a. 135 b. 115 С. 125 d. 100 Suppose the following economy produced...
How do you solve these GDP questions? Question 8 Not yet answed erasers. Which one is...
 How do you solve these GDP questions?
Question 8 Not yet answed erasers. Which one is the value nearest to an inflation rate by CPI between 2010 and 2011 using 2010 as a base year? Points out of 1.00 P Flag question Suppose the following economy produced pencils and erasers in 2010 and 2011 according to the following table. CPI basket in this economy consists of 5 pencils and 7 2010 P20102011 P2011 Pencils 5 10 8 30 Erasers 7...
How do you solve these GDP questions?
Question 8 Not yet answed erasers. Which one is the value nearest to an inflation rate by CPI between 2010 and 2011 using 2010 as a base year? Points out of 1.00 P Flag question Suppose the following economy produced pencils and erasers in 2010 and 2011 according to the following table. CPI basket in this economy consists of 5 pencils and 7 2010 P20102011 P2011 Pencils 5 10 8 30 Erasers 7...
5. Real versus nominal GDP Consider a simple economy that produces two goods: pencils and erasers....
 5. Real versus nominal GDP Consider a simple economy that produces two goods: pencils and erasers. The following table shows the prices and quantities of the goods over a three-year period. Pencils Price Quantity (Dollars per pencil (Number of pencils) 1 125 Erasers Price Quantity (Dollars per eraser (Number of erasers) 1 200 Year 2018 2019 170 4 230 2020 4 150 4 170 Use the information from the preceding table to fill in the following table. Nominal GDP (Dollars)...
19. (16 POINTS) Suppose that the representative basket of goods consumed in the economy in a...
 19. (16 POINTS) Suppose that the representative basket of goods consumed in the economy in a year is made of: 150 lbs of bread, 80 bottles of water and 50 T-shirts. Prices (in USD) of each of these items, across different years, are reported in the following table Year 1 lbs of bread 1 bottle of water 1 T-shirt 2008 S2 2009 $2.3 2010 $2.6 2011 $2.8 2012 S3 $1.2 $1.2 $1.35 $1.8 $1.8 $15 $18 $18 $18 $25 (a)...
2010 Prices 2011 Prices 2012 Prices Milk $2 $3 $4 Cookies $2 $3 $2 CPI A. For...
2010 Prices 2011 Prices 2012 Prices Milk $2 $3 $4 Cookies $2 $3 $2 CPI A. For a fixed basket of 5 glasses of milk and 10 cookies, and using the prices in the table, calculate the CPI in each year for this economy. 2010 is your base year. B. If the CPI in 2013 was 192 and the CPI in 2014 was 200, what would the inflation rate be? What would the inflation rate mean? C. If you earned $10/hour in 2010...
Assume that an economy produces only three goods; Computers, cars, and pizza. Table 1 gives the price and quantity for each good and the number of employed and unemployed individuals for the years 2010-2013. Table 2 gives the fixed basket used for calcula
 Assume that an economy produces
only three goods; Computers, cars, and pizza. Table 1 gives the price
and quantity for each good and the number of employed and unemployed
individuals for the years 2010-2013. Table 2 gives the fixed basket used
for calculating the CPI. Assume that the base year is 2011 and show
your work! Table 1 - Price and Quantity of Goods Sold in 2010-2013 2010
2011 2012 2013 P Q P O P Q 25 Computers Cars...
Assume that an economy produces
only three goods; Computers, cars, and pizza. Table 1 gives the price
and quantity for each good and the number of employed and unemployed
individuals for the years 2010-2013. Table 2 gives the fixed basket used
for calculating the CPI. Assume that the base year is 2011 and show
your work! Table 1 - Price and Quantity of Goods Sold in 2010-2013 2010
2011 2012 2013 P Q P O P Q 25 Computers Cars...
5. Inflation and CPI Suppose in Economy A, the final goods produced in year 2015, 2016...
 5. Inflation and CPI Suppose in Economy A, the final goods produced in year 2015, 2016 and 2017 are milk, beef, gasoline, cloth. The quantities (Q) produced and prices (P) are given by the following: Year 2015 Qmilk Pmilk 200 2.35 220 2.49 233 2.79 (beer Pbeer lgasolin 120 3.30 400 123 3.35 430 145 3.47 440 Pgasoline (cloth Pcloth 1.12 510 2.33 1.15 512 2.47 1.20 523 2.67 2016 2017 Let 2015 be the base year and assume the...
please include detailed steps with answers 2. The table below shows the market basket of a...
 please include detailed steps with answers
2. The table below shows the market basket of a hypothetical economy is given below. Item Cost in 2011 Cost in 2010 $500 $120 Rent, 2 BR apartment 60 Hamburgers $630 $150 10 Movie tickets $60 $70 Total expenditure $680 $850 CPI (Base = 2010) a. Complete the table. b. Calculate the inflation rate between 2010 and 2011. c. Suppose the CPI in 2012 is 150. Provide an interpretation for the value. d. Calculate...
please include detailed steps with answers
2. The table below shows the market basket of a hypothetical economy is given below. Item Cost in 2011 Cost in 2010 $500 $120 Rent, 2 BR apartment 60 Hamburgers $630 $150 10 Movie tickets $60 $70 Total expenditure $680 $850 CPI (Base = 2010) a. Complete the table. b. Calculate the inflation rate between 2010 and 2011. c. Suppose the CPI in 2012 is 150. Provide an interpretation for the value. d. Calculate...
1. Suppose there are only 3 different goods produced and consumed in a closed economy. The...
 1. Suppose there are only 3 different goods produced and consumed in a closed economy. The following table shows the prices and quantities of each good consumed in 2002, 2003, 2004, and 2005. Price of a Quantity of Price Price of Quantity pair of a pair of of Quantity Year Apple of Apple shoes Breed of Breed 3001000 1500 shoes 2002 2003 500 600 15 100 1200 2004 80020 3501300 2005 900 25 500 Calculate nominal GDP in each of...
 Suppose the following economy produced pencils and erasers in 2011 and 2012 according to the following table. CPl basket in this economy consists of 5 pencils and 7 erasers. Which one is the value nearest to an inflation rate by CPI between 2010 and 2011 using 2010 as a base year? Q2010 P2010 02011 P2011 Pencils 5 10 8 30 Erasers 7 20 15 40 Select one: a. 135 O b. 100 O c. 115 d. 125
 Suppose the following economy produced pencils and erasers in 2010 and 2011 according to the following table. CPI basket in this economy consists of 5 pencils and 7 erasers. Which one is the value nearest to an inflation rate by CPI between 2010 and 2011 using 2010 as a base year? 2010 2010 2011 2011 Pencils 5 10 8 30 Erasers 7 20 15 40 Select one a. 135 b. 115 С. 125 d. 100 Suppose the following economy produced...
 How do you solve these GDP questions?
Question 8 Not yet answed erasers. Which one is the value nearest to an inflation rate by CPI between 2010 and 2011 using 2010 as a base year? Points out of 1.00 P Flag question Suppose the following economy produced pencils and erasers in 2010 and 2011 according to the following table. CPI basket in this economy consists of 5 pencils and 7 2010 P20102011 P2011 Pencils 5 10 8 30 Erasers 7...
How do you solve these GDP questions?
Question 8 Not yet answed erasers. Which one is the value nearest to an inflation rate by CPI between 2010 and 2011 using 2010 as a base year? Points out of 1.00 P Flag question Suppose the following economy produced pencils and erasers in 2010 and 2011 according to the following table. CPI basket in this economy consists of 5 pencils and 7 2010 P20102011 P2011 Pencils 5 10 8 30 Erasers 7...
 5. Real versus nominal GDP Consider a simple economy that produces two goods: pencils and erasers. The following table shows the prices and quantities of the goods over a three-year period. Pencils Price Quantity (Dollars per pencil (Number of pencils) 1 125 Erasers Price Quantity (Dollars per eraser (Number of erasers) 1 200 Year 2018 2019 170 4 230 2020 4 150 4 170 Use the information from the preceding table to fill in the following table. Nominal GDP (Dollars)...
 19. (16 POINTS) Suppose that the representative basket of goods consumed in the economy in a year is made of: 150 lbs of bread, 80 bottles of water and 50 T-shirts. Prices (in USD) of each of these items, across different years, are reported in the following table Year 1 lbs of bread 1 bottle of water 1 T-shirt 2008 S2 2009 $2.3 2010 $2.6 2011 $2.8 2012 S3 $1.2 $1.2 $1.35 $1.8 $1.8 $15 $18 $18 $18 $25 (a)...
 5. Inflation and CPI Suppose in Economy A, the final goods produced in year 2015, 2016 and 2017 are milk, beef, gasoline, cloth. The quantities (Q) produced and prices (P) are given by the following: Year 2015 Qmilk Pmilk 200 2.35 220 2.49 233 2.79 (beer Pbeer lgasolin 120 3.30 400 123 3.35 430 145 3.47 440 Pgasoline (cloth Pcloth 1.12 510 2.33 1.15 512 2.47 1.20 523 2.67 2016 2017 Let 2015 be the base year and assume the...
 please include detailed steps with answers
2. The table below shows the market basket of a hypothetical economy is given below. Item Cost in 2011 Cost in 2010 $500 $120 Rent, 2 BR apartment 60 Hamburgers $630 $150 10 Movie tickets $60 $70 Total expenditure $680 $850 CPI (Base = 2010) a. Complete the table. b. Calculate the inflation rate between 2010 and 2011. c. Suppose the CPI in 2012 is 150. Provide an interpretation for the value. d. Calculate...
please include detailed steps with answers
2. The table below shows the market basket of a hypothetical economy is given below. Item Cost in 2011 Cost in 2010 $500 $120 Rent, 2 BR apartment 60 Hamburgers $630 $150 10 Movie tickets $60 $70 Total expenditure $680 $850 CPI (Base = 2010) a. Complete the table. b. Calculate the inflation rate between 2010 and 2011. c. Suppose the CPI in 2012 is 150. Provide an interpretation for the value. d. Calculate...
 1. Suppose there are only 3 different goods produced and consumed in a closed economy. The following table shows the prices and quantities of each good consumed in 2002, 2003, 2004, and 2005. Price of a Quantity of Price Price of Quantity pair of a pair of of Quantity Year Apple of Apple shoes Breed of Breed 3001000 1500 shoes 2002 2003 500 600 15 100 1200 2004 80020 3501300 2005 900 25 500 Calculate nominal GDP in each of...
Most questions answered within 3 hours.
-
Where is the error in this code sequence?
String s1 = "Hello";
String s2 = "ello";...
asked 11 months ago -
Financial data for Joel de Paris, Inc., for last year
follow:
Joel de Paris, Inc.
Balance...
asked 11 months ago -
Consider this reaction:
Al2(SO4)3 (aq)+ BaCl3
(aq) Al2Cl6 (aq)- +
3BaSO4(s) . What is the...
asked 11 months ago -
Suppose that Savneet is considering increasing her
recent random sample from 20 car rentals to 40...
asked 11 months ago -
Trucks arrive at an unloading terminal at an average rate of 120
per hour.
Trucks arrive...
asked 11 months ago -
Why are methanol and ethanol completely soluble in water while
octanol is not very little soluble....
asked 11 months ago -
A facilities manager at a university reads in a research report
that the mean amount of...
asked 11 months ago -
When the CuSO4 is rehydrated by adding water to the anhydrous
compound, is this an endothermic...
asked 11 months ago -
A ray of sunlight is passing from diamond into crown glass; the
angle of incidence is...
asked 11 months ago -
A block of mass 0.249 kg is placed on top of a light, vertical
spring of...
asked 11 months ago -
how do the kidneys compensate in the presences of acidosis
a) trigger hyperventilate
b) reserve acid...
asked 11 months ago -
Question 501 pts
The rental rate of capital to the firm increases. Which of the
following...
asked 11 months ago