Four different paints are advertised as having the same dryingtime. To check the manufacturer's claims, five...
Four different paints are advertised as having the same dryingtime. To check the manufacturer's claims, five samples were testedfor each of the paints. The time in minutes until the paint was dryenough for a second coat to be applied was recorded. The followingdata were obtained.
Excel or Minitab users: The data set is available in file namedPaint. All data sets can be found in your eBook or on your StudentCD.

- Compute the
values identified below (to 2 decimals, ifnecessary).
Sum of Squares,Treatment Sum of Squares,Error Mean Squares,Treatment Mean Squares,Error
- Calculate the
value of the test statistic (to 2 decimals).
Homework Answers
The concept of One-way ANOVA and test statistic is used to solve this problem.
One-way Analysis Of Variance or One-way ANOVA tests whether there is any statistically significant difference between the means of three or more than three groups which are not related to each other or are independent.
A standardized value computed using the sample data during the hypothesis testing is called test-statistic.
General form of the ANOVA table is defined as,
Sources of variation | Sum of squares | Degree of freedom | Mean square | F-statistic |
Between treatments |
|
|
|
|
Error |
|
|
| |
Total |
|
|


Where SST is sum of squares due to treatment, SSE is sum of squares due to error, TSS is total sum of squares, MST is mean squares due to treatment, MSE is mean squares due to error, F is the test statistic, k denotes the number of groups or levels of treatments and n is the total number of observations.
Treatments are the factors affecting the dependent variable and the test-statistic here is nothing but the F-statistic which is obtained by dividing the mean squares due to treatment by mean squares due to error that is .
.
(1)
Level of significance is
 . To test whether there is any significant difference between different paint categories that is paint1, paint2, paint3 and paint4, the null hypothesis is defined as follows,

It says that the mean drying time is the same for each type of paint.

It says that the mean drying time is different for each type of paint.
Test for analysis of variance is done using MINITAB. Steps to perform ANOVA in MINITAB are as follows,
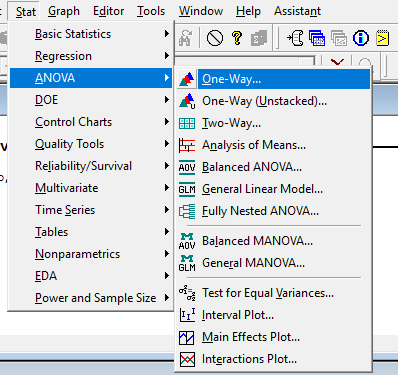
a. Click on Stat ANOVAOne-Way…, a new dialogue box will appear as shown in the next step.
Figure1
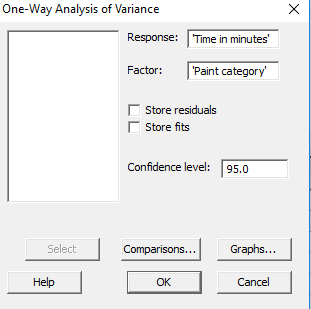
b. Select the variable time in minutes which will present there in the left box and take it into the box in front of response and do the same with the variable paint category and take it into the box in front of factor. The variables can be transferred by double clicking on them.
Figure2
c. Press “OK” button in the above dialogue box. The output obtained is shown in the screenshot below,
Figure3

The value of sum of squares due to treatment that is paint category can be obtained from ANOVA table in figure3 and is equal to .
.
The value of sum of squares due to error can be obtained from ANOVA table in figure3 and is equal to .
.
The value of mean squares due to treatment that is paint category can be obtained from ANOVA table in figure3 and is equal to .
.
The value of mean squares due to error can be obtained from ANOVA table in figure3 and is equal to .
.
Here, the treatments are paint categories. From the above screenshot it can be seen that  of
of  is greater than
  which depicts that
  may be accepted. Hence, there is no significant difference in the mean drying time of the different paint categories that is the mean drying time of all the paint categories is same.
(2)
The test statistic here is nothing but the F-statistic. The value of the F-statistic can be obtained from ANOVA table in figure3 and is equal to .
.
It can also be calculated using the formula. Values of MST and MSE can be obtained from part 1 and their values are . Hence,

Sum of squares, Treatment |
|
Sum of squares, Error |
|
Mean squares, Treatment |
|
Mean squares, Error |
|
The value of F-statistic is .
.
Add Answer to:
Four different
paints are advertised as having the same dryingtime. To check the
manufacturer's claims, five...
Four different paints are advertised as having the same drying time. To check the manufacturer's claims,...
 Four different paints are advertised as having the same drying time. To check the manufacturer's claims, five samples were tested for each of the paints. The time in minutes until the paint was dry enough for a second coat to be applied was recorded. The following data were obtained. Click on the datafile logo to reference the data DATA file Paint 1 Paint 2 144 133 142 146 130 Paint 3 128 137 135 124 141 133 143 137 136...
eBook Four different paints are advertised as having the same drying time. To check the manufacturer's...
 eBook Four different paints are advertised as having the same drying time. To check the manufacturer's claims, five samples were tested for each of the paints. The time in minutes until the paint was dry enough for a second coat to be applied was recorded. The following data were obtained. Excel users: The data set is available in file named Paint. All data sets can be found on the premium online datasite. Click on the datafile logo to reference the...
Four different paints are advertised as having the same drying time. To check the manufacturer's claims,...
Four different paints are advertised as having the same drying time. To check the manufacturer's claims, five samples were tested for each of the paints. The time in minutes until the paint was dry enough for a second coat to be applied was recorded. The following data were obtained. Click on the datafile logo to reference the data. At the = .05 level of significance, test to see whether the mean drying time is the same for each type of paint....
Q Search this cours er 13 Assignment Four different paints are advertised as having the same...
 Q Search this cours er 13 Assignment Four different paints are advertised as having the same drying time. To check the manufacturer's claims, five samples were tested for each of the paints. The time in minutes until the paint was dry enough for a second coat to be applied was recorded. The following data were obtained. Excel users: The data set is available in file named Paint. All data sets can be found on the premium online datasite. Click on...
5. Four different paints are advertised to have the same drying times. To verify the manufacturer's...
 5. Four different paints are advertised to have the same drying times. To verify the manufacturer's claim, seven samples were tested for each of the paints. The time in minutes untl the paint was dry enough for a second coat to be applied was recorded. Below are the results which may be imported into MSExcel for anatysls: (Assume the populations are normally distributed, the populations are independent and the population varlances are equal) Paint 1 Paint 2 Paint 3 Paint...
Four different paints are advertised to have the same drying times. Use the Kruskal Wallis Test...
Four different paints are advertised to have the same drying times. Use the Kruskal Wallis Test – Analysis of Variance by Ranks, to verify the manufacturer’s claim. Remember that seven samples were tested for each of the paints. The time in minutes until the paint was dry enough for a second coat to be applied was recorded. Below are the results. Paint 1 Rank Paint 2 Rank Paint 3 Rank Paint 4 Rank 114 112 126 115 117 118 127 117 120...
Please label and show each step Four different paints are advertised to have the same drying...
Please label and show each step Four different paints are advertised to have the same drying times. Use the Kruskal Wallis Test – Analysis of Variance by Ranks, to verify the manufacturer’s claim. Remember that seven samples were tested for each of the paints. The time in minutes until the paint was dry enough for a second coat to be applied was recorded. Below are the results. Paint 1 Rank Paint 2 Rank Paint 3 Rank Paint 4 Rank...
Please label and show each step. Four different paints are advertised to have the same drying...
Please label and show each step. Four different paints are advertised to have the same drying times. To verify the manufacturer’s claim, seven samples were tested for each of the paints. The time in minutes until the paint was dry enough for a second coat to be applied was recorded. Below are the results which may be imported into MSExcel for analysis: (Assume the populations are normally distributed, the populations are independent and the population variances are equal) Paint 1...
Questions Exercise 13.39 Algorithmic Question 4 of 7 Check My Work # eBook 5. 6. In...
 Questions Exercise 13.39 Algorithmic Question 4 of 7 Check My Work # eBook 5. 6. In a study conducted to investigate browsing activity by shoppers, each shopper was initially classified as a nonbrowser, light browser, or heavy browser. For each shopper, the study obtained a measure to determine how comfortable the shopper was in a store. Higher scores indicated greater comfort. Suppose the following data were collected. 7. Light Heavy Nonbrowser Browser Browser m 10 + i n + N...
To test wheter the mean time needed to mixabatch of material is the same for madtines...
 To test wheter the mean time needed to mixabatch of material is the same for madtines produced by three mansfacturers, the lacos Chemical Company obtained the folowing data on the time (in minutes) needed to mix the material 21 ute these data to test whether the pupulation mean times fr mixing a batch of mate' ial direr fur the tree marut actrers, use α- Compute the values below (to 2 decimals, if necessary) Sum of Squares, Treatment Sum of Squares,...
 Four different paints are advertised as having the same drying time. To check the manufacturer's claims, five samples were tested for each of the paints. The time in minutes until the paint was dry enough for a second coat to be applied was recorded. The following data were obtained. Click on the datafile logo to reference the data DATA file Paint 1 Paint 2 144 133 142 146 130 Paint 3 128 137 135 124 141 133 143 137 136...
 eBook Four different paints are advertised as having the same drying time. To check the manufacturer's claims, five samples were tested for each of the paints. The time in minutes until the paint was dry enough for a second coat to be applied was recorded. The following data were obtained. Excel users: The data set is available in file named Paint. All data sets can be found on the premium online datasite. Click on the datafile logo to reference the...
 Q Search this cours er 13 Assignment Four different paints are advertised as having the same drying time. To check the manufacturer's claims, five samples were tested for each of the paints. The time in minutes until the paint was dry enough for a second coat to be applied was recorded. The following data were obtained. Excel users: The data set is available in file named Paint. All data sets can be found on the premium online datasite. Click on...
 5. Four different paints are advertised to have the same drying times. To verify the manufacturer's claim, seven samples were tested for each of the paints. The time in minutes untl the paint was dry enough for a second coat to be applied was recorded. Below are the results which may be imported into MSExcel for anatysls: (Assume the populations are normally distributed, the populations are independent and the population varlances are equal) Paint 1 Paint 2 Paint 3 Paint...
 Questions Exercise 13.39 Algorithmic Question 4 of 7 Check My Work # eBook 5. 6. In a study conducted to investigate browsing activity by shoppers, each shopper was initially classified as a nonbrowser, light browser, or heavy browser. For each shopper, the study obtained a measure to determine how comfortable the shopper was in a store. Higher scores indicated greater comfort. Suppose the following data were collected. 7. Light Heavy Nonbrowser Browser Browser m 10 + i n + N...
 To test wheter the mean time needed to mixabatch of material is the same for madtines produced by three mansfacturers, the lacos Chemical Company obtained the folowing data on the time (in minutes) needed to mix the material 21 ute these data to test whether the pupulation mean times fr mixing a batch of mate' ial direr fur the tree marut actrers, use α- Compute the values below (to 2 decimals, if necessary) Sum of Squares, Treatment Sum of Squares,...
Most questions answered within 3 hours.
-
Where is the error in this code sequence?
String s1 = "Hello";
String s2 = "ello";...
asked 10 months ago -
Financial data for Joel de Paris, Inc., for last year
follow:
Joel de Paris, Inc.
Balance...
asked 10 months ago -
Consider this reaction:
Al2(SO4)3 (aq)+ BaCl3
(aq) Al2Cl6 (aq)- +
3BaSO4(s) . What is the...
asked 10 months ago -
Suppose that Savneet is considering increasing her
recent random sample from 20 car rentals to 40...
asked 10 months ago -
Trucks arrive at an unloading terminal at an average rate of 120
per hour.
Trucks arrive...
asked 10 months ago -
Why are methanol and ethanol completely soluble in water while
octanol is not very little soluble....
asked 10 months ago -
A facilities manager at a university reads in a research report
that the mean amount of...
asked 10 months ago -
When the CuSO4 is rehydrated by adding water to the anhydrous
compound, is this an endothermic...
asked 10 months ago -
A ray of sunlight is passing from diamond into crown glass; the
angle of incidence is...
asked 10 months ago -
A block of mass 0.249 kg is placed on top of a light, vertical
spring of...
asked 10 months ago -
how do the kidneys compensate in the presences of acidosis
a) trigger hyperventilate
b) reserve acid...
asked 10 months ago -
Question 501 pts
The rental rate of capital to the firm increases. Which of the
following...
asked 10 months ago