Toby's Trucking Company determined that on an annual basis the distance traveled per truck is normally...
a. What proportion of trucks can be expected to travel between 34.0 and 50.0 thousand miles in the year?
b. What is the probability that a randomly selected truck travels between 34.0 and 38.0 thousand miles in the year?
c. What percentage of trucks can be expected to travel either below 30.0 or above 60.0 thousand miles in the year?
d. How many of the 1,000 trucks in the fleet are expected to travel between 30.0 and 60.0 thousand miles in the year?
e. How many miles will be traveled by at least 80% of the trucks?
f. What will your answers to be (a)-(e) if the standard deviation is 10.0 thousand miles?
Homework Answers
The concept of normal distribution and standard normal variate is used to solve this problem.
A normal distribution is a probability distribution with the mean as and standard deviation as
 . The normal probability curve is a type of curve which is bell shaped.
The standard normal variate is a normal distribution which has mean equal to zero and standard deviation equal to one and the curve of this variate is bell shaped.
Normal distribution is a probability distribution with the parameters  and
and  the continuous random variable X follows a normal distribution,

Where the mean is and the variance is
 . The formula to find the Z-Score is,

The probability of z is calculated by using the Excel function,  .
.
The  of a probability is calculated by using the Excel function,
  .
.
(a)
Consider the random variable X which represent the distance travelled by truck. The random variable is normally distributed with mean
 thousand miles and standard deviation
  thousand miles.
The probability that the expected distance travelled by truck is between  thousand miles and
  thousand miles is calculated as:

The probabilities for the standard normal distribution are calculated by using Excel:

And
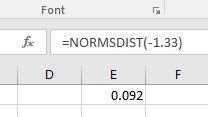
So,

(b)
The probability that truck travels between 34.0 and 38.0 thousand miles in the year can be calculated as:

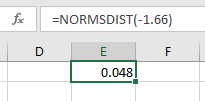
The probabilities are calculated using Excel:
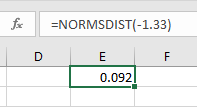
And,

So, the required probability is,

(c)
The percentage of trucks that are expected to travel less than 30 thousand miles can be calculated as:

The percentage of trucks that are expected to travel more than 60 thousand miles can be calculated as:


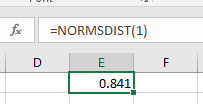
The probabilities are calculated using Excel:
And.

So, the required probability can be calculated as:

(d)
Use the concept of complementary event, to find the probability that a truck travels between 30 thousand miles and 60 thousand miles by subtracting the probability that a truck travels below 30 thousand miles or more than 60 thousand miles from 1 as:

So to find the trucks travel between 30 thousand miles and 60 thousand miles per thousand is calculated by multiplied the probability by 1000.

(e)
The expected distance in thousand miles travelled by at least  of the trucks can be calculated as:

The Z-score corresponding to probability 0.8 can be computed using Excel as:

Hence, the calculation is,

(f.1)
Consider the random variable X which represent the distance travelled by truck. The mean is thousand miles and standard deviation is thousand miles.
The probability that the expected travel by truck is between thousand miles and thousand miles is calculated as,

The probabilities are calculated using Excel:

And,

So, the required probability can be calculated as:

(f.2)
The probability of the trucks that travel between 34.0 thousand miles to 38.0 thousand miles is calculated as,

The probabilities are calculated using Excel:
And,

So, the required probability can be calculated as:

(f.3)
The percentage of trucks that travel less than 30 thousand miles is calculated as:

The percentage of trucks that travel more than 60 thousand miles is calculated as:

The probabilities are calculated using Excel:

And,
So,

(f.4)
Use the concept of complementary event to find the probability that a track travel between 30 thousand miles and 60 thousand miles subtract the probability that a truck travels below 30 thousand miles or more than 60 thousand miles,

So to find the trucks travel between 30 thousand miles and 60 thousand miles per thousand is calculated by multiplied the probability by 1000.

(f.5)
The expected distance in thousand miles travelled by at least of the trucks can be calculated as:

The Z-score corresponding to probability 0.8 can be computed using Excel as:

Hence, the calculation is,

The proportion of the trucks that is expected to travel between 34 thousand to 50 thousand miles is  .
.
The probability that the randomly selected truck travels between 34 thousand miles to 38 thousand miles is 0.066.
Part cThe percentage of trucks that are expected to travel below 30.0 or above 60.0 thousand miles is  .
.
The number of trucks that are expected to travel between 30 thousand miles and 60 thousand miles is 750.
Part eThe distance in thousand miles travelled by at least of the trucks is 60.12.
The proportion of the trucks that travel between 34.0 thousand miles to 50.0 thousand miles is  .
.
The probability that the randomly selected truck will travel between 34.0 thousand miles to 38.0 thousand miles is 0.06.
Part f.3The percentage of trucks that are expected to travel below 30.0 thousand miles or above 60.0 thousand miles is  .
.
The number of trucks that travel between 30 thousand miles and 60 thousand miles is 819.
Part f.5The distance in thousand miles travelled by at least of the trucks is 58.42.
Add Answer to:
Toby's Trucking Company determined that on an annual basis the
distance traveled per truck is normally...
A trucking company determined that the distance traveled per truck per year is normally distributed, with...
 A trucking company determined that the distance traveled per truck per year is normally distributed, with a mean of 30 thousand miles and a standard deviation of 11 thousand miles. Complete parts (a) through (d) below. a. What proportion of trucks can be expected to travel between 17 and 30 thousand miles in a year? The proportion of trucks that can be expected to travel between 17 and 30 thousand miles in a year is (Round to four decimal places...
A trucking company determined that the distance traveled per truck per year is normally distributed, with...
A trucking company determined that the distance traveled per truck per year is normally distributed, with a mean of 50 thousand miles and a standard deviation of 12 thousand miles. What percentage of trucks can be expected to travel either less than 35 or more than 70 thousand miles in a year? Round to two decimal places as needed.
1. Toby's Trucking Company determined that on an annual basis, the distance traveled per truck is...
 1. Toby's Trucking Company determined that on an annual basis, the distance traveled per truck is normally distributed, with a mean of 50,000 miles and a standard deviation of 12,000 miles. a. What proportion of trucks can be expected to travel between 38,000 and 62,000 miles in the year? b. What percentage of the trucks travel less than 35,000 miles in the year? c. What percentage of the trucks travel more than 57,000 miles in the year? d. How many...
12. A trucking company determined that the distance traveled per truck per year in its entire...
 12. A trucking company determined that the distance traveled per truck per year in its entire fleet was normally distributed with a mean of 55 thousand miles and a standard deviation of 11 thousand miles. a)A truck in the fleet traveled 42 thousand miles in the last vear. Calculate the z-score for this truck. (3 points) b) Interpret the z-score (3 points) c) The trucking company has a policy that any truck with mileage more than 2.5 standard deviations above...
using normal distribution with steps please SELF (6.8 Toby's Trucking Company determined that the dis- TEST...
 using normal distribution with steps please
SELF (6.8 Toby's Trucking Company determined that the dis- TEST tance traveled per truck per year is normally distributed, with a mean of 50 thousand miles and a standard deviation of 12 thousand miles. a. What proportion of trucks can be expected to travel between 34 and 50 thousand miles in a year? b. What percentage of trucks can be expected to travel either less than 30 or more than 60 thousand miles in...
using normal distribution with steps please
SELF (6.8 Toby's Trucking Company determined that the dis- TEST tance traveled per truck per year is normally distributed, with a mean of 50 thousand miles and a standard deviation of 12 thousand miles. a. What proportion of trucks can be expected to travel between 34 and 50 thousand miles in a year? b. What percentage of trucks can be expected to travel either less than 30 or more than 60 thousand miles in...
just the last ones on this A trucking company determined that the distance traveled per truck...
 just the last ones on this
A trucking company determined that the distance traveled per truck per year is normally distributed, with a mean of 80 thousand miles and a standard deviation of 10 thousand miles. Complete parts (a) through (c) below. a. What proportion of trucks can be expected to travel between 69 and 80 thousand miles in a year? The proportion of trucks that can be expected to travel between 69 and 80 thousand miles in a year...
just the last ones on this
A trucking company determined that the distance traveled per truck per year is normally distributed, with a mean of 80 thousand miles and a standard deviation of 10 thousand miles. Complete parts (a) through (c) below. a. What proportion of trucks can be expected to travel between 69 and 80 thousand miles in a year? The proportion of trucks that can be expected to travel between 69 and 80 thousand miles in a year...
5. value 10.00 points Fast Service Truck Lines uses the Ford Super Duty F-750 exclusively. Management made a study of the maintenance costs and determined the number of miles traveled during the...
 5. value 10.00 points Fast Service Truck Lines uses the Ford Super Duty F-750 exclusively. Management made a study of the maintenance costs and determined the number of miles traveled during the year followed the normal distribution. The mean of the distribution was 60,000 miles and the standard deviation 2,000 miles. (Round z-score computation to 2 decimal places and your fihal answer to 2 decimal places.) (a) What percent of the Ford Super Duty F-750s logged 65,200 miles or more?...
What are the Solutions to Part B of Chapter 2 of Tillery Physics 9th edition.......kinda pointless...
What are the Solutions to Part B of Chapter 2 of Tillery Physics 9th edition.......kinda pointless for you guys to only have the solutions that the book has already. 1. What was the average speed in km/h of a car that travels 400.0 km in 4.5 h? 2. What was the average speed in km/h of a boat that moves 15.0 km across a lake in 45 min? 3. How much would a 80.0 kg person weigh (a) on Mars,...
Ashley Oakley was hired by the Battleground Nurseries (BN), a commercial nursery and landscape supply company...
Ashley Oakley was hired by the Battleground Nurseries (BN), a commercial nursery and landscape supply company in Oak Ridge, NC, as an Analyst in their newly-formed Project Office (PO). She reported to work and was assigned a small cubicle with an old laptop computer. Not what she had hoped for in her first job, but she was grateful to land her first job in a rapidly growing economy and resolved to give it her best effort. The PO reported to...
 A trucking company determined that the distance traveled per truck per year is normally distributed, with a mean of 30 thousand miles and a standard deviation of 11 thousand miles. Complete parts (a) through (d) below. a. What proportion of trucks can be expected to travel between 17 and 30 thousand miles in a year? The proportion of trucks that can be expected to travel between 17 and 30 thousand miles in a year is (Round to four decimal places...
 1. Toby's Trucking Company determined that on an annual basis, the distance traveled per truck is normally distributed, with a mean of 50,000 miles and a standard deviation of 12,000 miles. a. What proportion of trucks can be expected to travel between 38,000 and 62,000 miles in the year? b. What percentage of the trucks travel less than 35,000 miles in the year? c. What percentage of the trucks travel more than 57,000 miles in the year? d. How many...
 12. A trucking company determined that the distance traveled per truck per year in its entire fleet was normally distributed with a mean of 55 thousand miles and a standard deviation of 11 thousand miles. a)A truck in the fleet traveled 42 thousand miles in the last vear. Calculate the z-score for this truck. (3 points) b) Interpret the z-score (3 points) c) The trucking company has a policy that any truck with mileage more than 2.5 standard deviations above...
 using normal distribution with steps please
SELF (6.8 Toby's Trucking Company determined that the dis- TEST tance traveled per truck per year is normally distributed, with a mean of 50 thousand miles and a standard deviation of 12 thousand miles. a. What proportion of trucks can be expected to travel between 34 and 50 thousand miles in a year? b. What percentage of trucks can be expected to travel either less than 30 or more than 60 thousand miles in...
using normal distribution with steps please
SELF (6.8 Toby's Trucking Company determined that the dis- TEST tance traveled per truck per year is normally distributed, with a mean of 50 thousand miles and a standard deviation of 12 thousand miles. a. What proportion of trucks can be expected to travel between 34 and 50 thousand miles in a year? b. What percentage of trucks can be expected to travel either less than 30 or more than 60 thousand miles in...
 just the last ones on this
A trucking company determined that the distance traveled per truck per year is normally distributed, with a mean of 80 thousand miles and a standard deviation of 10 thousand miles. Complete parts (a) through (c) below. a. What proportion of trucks can be expected to travel between 69 and 80 thousand miles in a year? The proportion of trucks that can be expected to travel between 69 and 80 thousand miles in a year...
just the last ones on this
A trucking company determined that the distance traveled per truck per year is normally distributed, with a mean of 80 thousand miles and a standard deviation of 10 thousand miles. Complete parts (a) through (c) below. a. What proportion of trucks can be expected to travel between 69 and 80 thousand miles in a year? The proportion of trucks that can be expected to travel between 69 and 80 thousand miles in a year...
 5. value 10.00 points Fast Service Truck Lines uses the Ford Super Duty F-750 exclusively. Management made a study of the maintenance costs and determined the number of miles traveled during the year followed the normal distribution. The mean of the distribution was 60,000 miles and the standard deviation 2,000 miles. (Round z-score computation to 2 decimal places and your fihal answer to 2 decimal places.) (a) What percent of the Ford Super Duty F-750s logged 65,200 miles or more?...
Most questions answered within 3 hours.
-
Where is the error in this code sequence?
String s1 = "Hello";
String s2 = "ello";...
asked 11 months ago -
Financial data for Joel de Paris, Inc., for last year
follow:
Joel de Paris, Inc.
Balance...
asked 11 months ago -
Consider this reaction:
Al2(SO4)3 (aq)+ BaCl3
(aq) Al2Cl6 (aq)- +
3BaSO4(s) . What is the...
asked 11 months ago -
Suppose that Savneet is considering increasing her
recent random sample from 20 car rentals to 40...
asked 11 months ago -
Trucks arrive at an unloading terminal at an average rate of 120
per hour.
Trucks arrive...
asked 11 months ago -
Why are methanol and ethanol completely soluble in water while
octanol is not very little soluble....
asked 11 months ago -
A facilities manager at a university reads in a research report
that the mean amount of...
asked 11 months ago -
When the CuSO4 is rehydrated by adding water to the anhydrous
compound, is this an endothermic...
asked 11 months ago -
A ray of sunlight is passing from diamond into crown glass; the
angle of incidence is...
asked 11 months ago -
A block of mass 0.249 kg is placed on top of a light, vertical
spring of...
asked 11 months ago -
how do the kidneys compensate in the presences of acidosis
a) trigger hyperventilate
b) reserve acid...
asked 11 months ago -
Question 501 pts
The rental rate of capital to the firm increases. Which of the
following...
asked 11 months ago