7. Judge and Cable (2010) demonstrated a positive relationship between weight and income for a group...
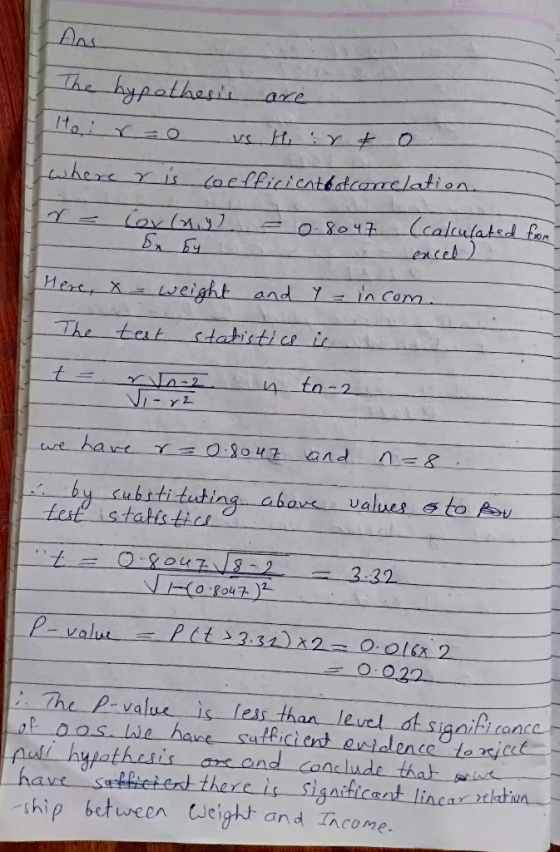
7. Judge and Cable (2010) demonstrated a positive relationship between weight and income for a group of men. The following data are similar to those obtained in the study. The weight is measured in kg and the monthly income is measured in 1,000,000KRW. Based on the data given in the table below, can you conclude that weight and income have a significant relationship? Perform a correlation analysis at α = 0.05.
|
Weight |
80 |
82 |
75 |
73 |
65 |
70 |
66 |
90 |
|
Income |
4.5 |
3.8 |
3.2 |
4.1 |
2.8 |
4.0 |
3.3 |
5.1 |
- Step 1. State the hypotheses (both in words and in symbols)
- H0:
- H1:
- Step 2: α = 0.05
- Step 3: Make a decision.
- Step 4: State a conclusion (You should include the obtained Pearson’s correlation coefficient, p-value, effect size, and a verbal interpretation of the result).
Homework Answers
Add Answer to:
7. Judge and Cable (2010) demonstrated a positive relationship between weight and income for a group...
problem 9 presented data showing a positive relationship between weight and income for a sample of...
problem 9 presented data showing a positive relationship between weight and income for a sample of professional men. however weight was coded in five categories that could be viewed as an ordinal scale rather than an interval or ratio scale. if so, a spearman correlation is more appropriate than a pearson correlation. convert the weights and the incomes into ranks and compute the spearman correlation for the scores in problem 9. Weight (x) : 4 5 3 2 1 3...
6. A researcher wishes to test the effect of early discharge of cardiac patients on their...
6. A researcher wishes to test the effect of early discharge of cardiac patients on their ability to cope at home. The researcher administers the coping scale to 10 cardiac patients who were discharged early and 10 patients who stayed in the hospital for a longer period of time. Higher scores indicate better coping. Based on the data given in the table below, can you conclude that early discharge has an effect on cardiac patients’ on ability to cope at...
2. An economist wants annual amount spent on clothing and members and family income ten families for estimation ie the relationship between the she uses the following data of s to determine detan...
 2. An economist wants annual amount spent on clothing and members and family income ten families for estimation ie the relationship between the she uses the following data of s to determine detand elat of family the number Annual expenditure Number of (%) on clothing . | Annual family°(%) 1,000)tamily members income (1,000) 35 25 15 37 48 27 0.9 3.8 35 35 25 51 0 4.0 ら The least-square estimate is ,s-1.43+0.446x +.080 a) Give an interpretation for the...
A study was done to look at the relationship between the number of lovers college students...
A study was done to look at the relationship between the number of lovers college students have had in their lifetimes and their GPAs. The results of the survey are shown below. Lovers 0 2 6 6 1 5 2 0 5 GPA 3.4 3.6 2.9 2.2 3.7 3.1 3.6 3.2 2.8 x value y value Find the correlation coefficient: r=r= Round to 2 decimal places. The null and alternative hypotheses for correlation are: H0:H0: ? ρ r μ == 0 H1:H1:...
What is the relationship between the amount of time statistics students study per week and their...
What is the relationship between the amount of time statistics students study per week and their test scores? The results of the survey are shown below. Time 16 14 15 6 14 15 6 Score 100 89 100 68 99 100 78 x-values y-values Find the correlation coefficient: r=r= Round to 2 decimal places. The null and alternative hypotheses for correlation are: H0:H0: ? ρ r μ == 0 H1:H1: ? μ r ρ ≠≠ 0 The p-value is: (Round to four decimal...
What is the relationship between the amount of time statistics students study per week and their...
What is the relationship between the amount of time statistics students study per week and their test scores? The results of the survey are shown below. Time 13 10 9 9 2 10 12 8 Score 84 83 90 76 74 86 99 85 x-values y-values Find the correlation coefficient: r=r= Round to 2 decimal places. The null and alternative hypotheses for correlation are: H0:H0: ? r ρ μ == 0 H1:H1: ? μ ρ r ≠≠ 0 The p-value is: (Round to...
2 This is the problem to be solved: This is a sample of the information needed:...
 2
This is the problem to be solved:
This is a sample of the information needed:
Homework: HW-12 Save Score: 10 of 15 pts HUN Score: 24%, 24 of 100 pts 2 of 7 (2 complete) 14.2.10-1T Question Help A university would like to describe the relationship between the GPA and the starting monthly salary of a graduate who earned a business degree from the university. The table shown below gives the monthly starting salaries for five graduates of the...
2
This is the problem to be solved:
This is a sample of the information needed:
Homework: HW-12 Save Score: 10 of 15 pts HUN Score: 24%, 24 of 100 pts 2 of 7 (2 complete) 14.2.10-1T Question Help A university would like to describe the relationship between the GPA and the starting monthly salary of a graduate who earned a business degree from the university. The table shown below gives the monthly starting salaries for five graduates of the...
A study was done to look at the relationship between the number of movies people watch...
A study was done to look at the relationship between the number of movies people watch at the theater each year and the number of books that they read each year. The results of the survey are shown below. Movies 2 2 2 2 7 10 2 2 9 7 6 1 Books 10 6 6 6 3 0 8 5 1 6 2 6 x value y value Find the correlation coefficient: r=r= Round to 2 decimal places. The null...
SPSS Homework 1 Instructions: Review and One-Way ANOVAs (40 points) Please note that for all problems...
SPSS Homework 1 Instructions: Review and One-Way ANOVAs (40 points) Please note that for all problems in this course, the standard cut-off (alpha) for a test of significance will be .05, and you always report the exact power unless SPSS output states p=.000 (you’d report p<.001). Also, remember that we divide the p value in half when reporting one-tailed tests with 1 – 2 groups. Problem Set 2: Pearson’s correlation (7 pts) Research Scenario: Is there a positive relationship between...
 2. An economist wants annual amount spent on clothing and members and family income ten families for estimation ie the relationship between the she uses the following data of s to determine detand elat of family the number Annual expenditure Number of (%) on clothing . | Annual family°(%) 1,000)tamily members income (1,000) 35 25 15 37 48 27 0.9 3.8 35 35 25 51 0 4.0 ら The least-square estimate is ,s-1.43+0.446x +.080 a) Give an interpretation for the...
 2
This is the problem to be solved:
This is a sample of the information needed:
Homework: HW-12 Save Score: 10 of 15 pts HUN Score: 24%, 24 of 100 pts 2 of 7 (2 complete) 14.2.10-1T Question Help A university would like to describe the relationship between the GPA and the starting monthly salary of a graduate who earned a business degree from the university. The table shown below gives the monthly starting salaries for five graduates of the...
2
This is the problem to be solved:
This is a sample of the information needed:
Homework: HW-12 Save Score: 10 of 15 pts HUN Score: 24%, 24 of 100 pts 2 of 7 (2 complete) 14.2.10-1T Question Help A university would like to describe the relationship between the GPA and the starting monthly salary of a graduate who earned a business degree from the university. The table shown below gives the monthly starting salaries for five graduates of the...
Most questions answered within 3 hours.
-
Where is the error in this code sequence?
String s1 = "Hello";
String s2 = "ello";...
asked 10 months ago -
Financial data for Joel de Paris, Inc., for last year
follow:
Joel de Paris, Inc.
Balance...
asked 10 months ago -
Consider this reaction:
Al2(SO4)3 (aq)+ BaCl3
(aq) Al2Cl6 (aq)- +
3BaSO4(s) . What is the...
asked 10 months ago -
Suppose that Savneet is considering increasing her
recent random sample from 20 car rentals to 40...
asked 10 months ago -
Trucks arrive at an unloading terminal at an average rate of 120
per hour.
Trucks arrive...
asked 10 months ago -
Why are methanol and ethanol completely soluble in water while
octanol is not very little soluble....
asked 10 months ago -
A facilities manager at a university reads in a research report
that the mean amount of...
asked 10 months ago -
When the CuSO4 is rehydrated by adding water to the anhydrous
compound, is this an endothermic...
asked 10 months ago -
A ray of sunlight is passing from diamond into crown glass; the
angle of incidence is...
asked 10 months ago -
A block of mass 0.249 kg is placed on top of a light, vertical
spring of...
asked 10 months ago -
how do the kidneys compensate in the presences of acidosis
a) trigger hyperventilate
b) reserve acid...
asked 10 months ago -
Question 501 pts
The rental rate of capital to the firm increases. Which of the
following...
asked 10 months ago