The following table lists two goods along with their cross-price elasticities, where the percentage change in...
The following table lists two goods along with their cross-price elasticities, where the percentage change in quantity is measured for Good 1 and the percentage change in price is for Good 2. Identify the relationship between the two goods.
 --------------------------------------------------------------------------------------------------------------------------------------------------
Homework Answers

Add Answer to:
The following table lists two goods along with their cross-price
elasticities, where the percentage change in...
The table shown lists two goods along with their cross-price elasticities, where the percentage change in...
The table shown lists two goods along with their cross-price elasticities, where the percentage change in quantity is measured for Good 1 and the percentage change in price is for Good 2. Identify the relationship between each of the pairs of goods. Good 1 Good 2 Cross-price elasticity of demand Relationship air-conditioning units electricity −0.38 Coca-Cola Pepsi +0.67 coffee creamer −0.25 McDonald's burgers In-N-Out burgers +0.82 mystery good A mystery good B +1.57 Answer Bank substitutes complements normal no relationship...
The cross-price elasticity of coffee and tea is 0.6, where the percentage change in quantity is...
 The cross-price elasticity of coffee and tea is 0.6, where the percentage change in quantity is for coffee and the percentage change in price is measured for tea. If the price of tea increases by 6.0%, what will the percentage change in the quantity demanded of coffee (%AQ) be? Enter the response to one decimal place and enter a negative number if the quantity demanded decreases. %AQP for coffee: The cross-price elasticity of bows and violins is -0.3, where the...
The price elasticity of demand is equal to the percentage change in price divided by the percentage change...
 The price elasticity of demand is equal to the percentage change in price divided by the percentage change in quantity demanded the change in quantity demanded divided by the change in price. the value of the slope of the demand curve. the percentage change in quantity demanded divided by the percentage change in price If 20 units are sold at a price of US$50 and 30 units are sold at a price of US$40, what is the absolute value of...
1. Elasticities Consider the following supply and demand functions AD = 16-4p Is2 +5p a) Plot the supply and demand...
 1. Elasticities Consider the following supply and demand functions AD = 16-4p Is2 +5p a) Plot the supply and demand functions. b) What are the equilibrium price and quantity? c) At the equilibrium price and quantity, what is the price elasticity of demand? d) Interpret the price elasticity of demand. How much will quantity change if the price increases by 1%? e) Suppose I were to calculate an income elasticity of 0.1. What does this imply about the good in...
1. Elasticities Consider the following supply and demand functions qD12-3p s3+2p a) Plot the supply and...
 1. Elasticities Consider the following supply and demand functions qD12-3p s3+2p a) Plot the supply and demand function:s b) What are the equilibrium price and quantity? c) At the equilibrium price and quantity, what is the price elasticity of demand? d) Interpret the price elasticity of demand. How much will quantity change if the price increases by 1%? e) Suppose I were to calculate an income elasticity of ξ 0.5. What does this imply about the good in our market?...
2. Table 2 presents the representative income elasticities for three categories of goods: Transportation, Food,...
2. Table 2 presents the representative income elasticities for three categories of goods: Transportation, Food, and nonfed Ground Beef. (Note: Nonfed ground beef comes from cattle that have not been fed a special diet to produce more tender beef. Most cattle are fed corn for 90 to 120 days before going to market and thus produce more tender beef than nonfed cattle.) In Table 2 below, the elasticity is interpreted as the percentage change in the quantity...
d. Calculate the following different elasticities: i. A price increase from P2 to P10 causes quantity...
d. Calculate the following different elasticities: i. A price increase from P2 to P10 causes quantity demanded to change from 80 units to 30 units. Calculate and interpret price elasticity of demand. (3 marks) ii. Income increase by 10% results in quantity demanded increases by 5%. Calculate and interpret income elasticity of demand. (2 marks) iii. Quantity of good B increases by 50% because of an increase in price of good A by 40%. Calculate and interpret cross elasticity of...
4. (25 points) The following table provides data on price elasticities related to public transit. Suppose...
 4. (25 points) The following table provides data on price elasticities related to public transit. Suppose the current price of a ride on public transit is $1.00. Peak riders ride at rush hour, off-peak riders travel at other times. Elasticity El for Public Transit (Peak Riders) El for Public Transit (Off-Peak Riders) Cross-Price Elasticity of Demand for automobile trips with respect to public transit fare price Short Term 0.25 0.45 Long Term 0.50 0.90 0.25 0.07 a. Explain why the...
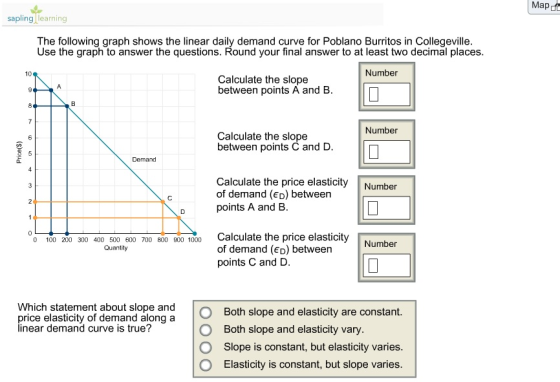
A linear downward-sloping demand curve has price elasticities (in absolute values) that increase as price decreases....
 A linear downward-sloping demand curve has price elasticities (in absolute values) that increase as price decreases. remain constant along the demand curve. decrease as price decreases. are greater than or equal to 1. Suppose a hurricane decreased the supply of oranges so that the price of oranges rose from $120 a ton to $180 a ton and quantity sold decreased from 800 tons to 240 tons. What is the absolute value of the price elasticity of demand? 0,11 0.37 9.33...
Having a hard time on the last question For each scenario, calculate the cross-price elasticity between...
 Having a hard time on the last question
For each scenario, calculate the cross-price elasticity between the two goods and identify how the goods are related. Please use the midpoint method when applicable, and specify answers to one decimal place. A 20% price increase for Product A causes a 10% decrease in its quantity demanded, but no change in the quantity demanded for Product B. cross-price elasticity between A and B: relationship between A and B: no relationship Product Cincreases...
Having a hard time on the last question
For each scenario, calculate the cross-price elasticity between the two goods and identify how the goods are related. Please use the midpoint method when applicable, and specify answers to one decimal place. A 20% price increase for Product A causes a 10% decrease in its quantity demanded, but no change in the quantity demanded for Product B. cross-price elasticity between A and B: relationship between A and B: no relationship Product Cincreases...
 The cross-price elasticity of coffee and tea is 0.6, where the percentage change in quantity is for coffee and the percentage change in price is measured for tea. If the price of tea increases by 6.0%, what will the percentage change in the quantity demanded of coffee (%AQ) be? Enter the response to one decimal place and enter a negative number if the quantity demanded decreases. %AQP for coffee: The cross-price elasticity of bows and violins is -0.3, where the...
 The price elasticity of demand is equal to the percentage change in price divided by the percentage change in quantity demanded the change in quantity demanded divided by the change in price. the value of the slope of the demand curve. the percentage change in quantity demanded divided by the percentage change in price If 20 units are sold at a price of US$50 and 30 units are sold at a price of US$40, what is the absolute value of...
 1. Elasticities Consider the following supply and demand functions AD = 16-4p Is2 +5p a) Plot the supply and demand functions. b) What are the equilibrium price and quantity? c) At the equilibrium price and quantity, what is the price elasticity of demand? d) Interpret the price elasticity of demand. How much will quantity change if the price increases by 1%? e) Suppose I were to calculate an income elasticity of 0.1. What does this imply about the good in...
 1. Elasticities Consider the following supply and demand functions qD12-3p s3+2p a) Plot the supply and demand function:s b) What are the equilibrium price and quantity? c) At the equilibrium price and quantity, what is the price elasticity of demand? d) Interpret the price elasticity of demand. How much will quantity change if the price increases by 1%? e) Suppose I were to calculate an income elasticity of ξ 0.5. What does this imply about the good in our market?...
 4. (25 points) The following table provides data on price elasticities related to public transit. Suppose the current price of a ride on public transit is $1.00. Peak riders ride at rush hour, off-peak riders travel at other times. Elasticity El for Public Transit (Peak Riders) El for Public Transit (Off-Peak Riders) Cross-Price Elasticity of Demand for automobile trips with respect to public transit fare price Short Term 0.25 0.45 Long Term 0.50 0.90 0.25 0.07 a. Explain why the...
 A linear downward-sloping demand curve has price elasticities (in absolute values) that increase as price decreases. remain constant along the demand curve. decrease as price decreases. are greater than or equal to 1. Suppose a hurricane decreased the supply of oranges so that the price of oranges rose from $120 a ton to $180 a ton and quantity sold decreased from 800 tons to 240 tons. What is the absolute value of the price elasticity of demand? 0,11 0.37 9.33...
 Having a hard time on the last question
For each scenario, calculate the cross-price elasticity between the two goods and identify how the goods are related. Please use the midpoint method when applicable, and specify answers to one decimal place. A 20% price increase for Product A causes a 10% decrease in its quantity demanded, but no change in the quantity demanded for Product B. cross-price elasticity between A and B: relationship between A and B: no relationship Product Cincreases...
Having a hard time on the last question
For each scenario, calculate the cross-price elasticity between the two goods and identify how the goods are related. Please use the midpoint method when applicable, and specify answers to one decimal place. A 20% price increase for Product A causes a 10% decrease in its quantity demanded, but no change in the quantity demanded for Product B. cross-price elasticity between A and B: relationship between A and B: no relationship Product Cincreases...
Most questions answered within 3 hours.
-
Where is the error in this code sequence?
String s1 = "Hello";
String s2 = "ello";...
asked 10 months ago -
Financial data for Joel de Paris, Inc., for last year
follow:
Joel de Paris, Inc.
Balance...
asked 10 months ago -
Consider this reaction:
Al2(SO4)3 (aq)+ BaCl3
(aq) Al2Cl6 (aq)- +
3BaSO4(s) . What is the...
asked 10 months ago -
Suppose that Savneet is considering increasing her
recent random sample from 20 car rentals to 40...
asked 10 months ago -
Trucks arrive at an unloading terminal at an average rate of 120
per hour.
Trucks arrive...
asked 10 months ago -
Why are methanol and ethanol completely soluble in water while
octanol is not very little soluble....
asked 10 months ago -
A facilities manager at a university reads in a research report
that the mean amount of...
asked 10 months ago -
When the CuSO4 is rehydrated by adding water to the anhydrous
compound, is this an endothermic...
asked 10 months ago -
A ray of sunlight is passing from diamond into crown glass; the
angle of incidence is...
asked 10 months ago -
A block of mass 0.249 kg is placed on top of a light, vertical
spring of...
asked 10 months ago -
how do the kidneys compensate in the presences of acidosis
a) trigger hyperventilate
b) reserve acid...
asked 10 months ago -
Question 501 pts
The rental rate of capital to the firm increases. Which of the
following...
asked 10 months ago