2. A small study (n=10) is designed to assess if there is an association between smoking in pregnancy and low birth weight. Low birth weight babies are those born less than 5.5 pounds. The following data represent the birth weights, in pounds, of babies born to mothers who reported smoking in pregnancy and those who did not.
Mother smoked in pregnancy 5.0 4.2 4.8 3.3 3.9
Mother did not smoke during pregnancy 5.1 4.9 5.3 5.4 4.6
Is there a significant difference in birth weights between mother who smoked during pregnancy and those who did not? Apply the Mann Whitney U Test at a 5% level of significance.
Complete the table below.
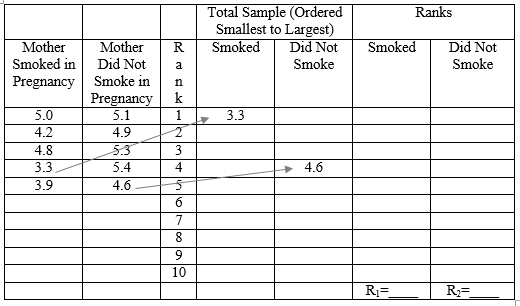
2. cont.

Alpha= ________
N1= ________
N2= ________
Critical value U= ________
Smaller of U1 and U2 = ________
Based on comparing the Smaller of U1 and U2 to the Critical value which of the following is (are) true?
- There is significant evidence at alpha=0.05 to show that the populations of birth weights in mothers who smoked in pregnancy and those who did not are not equal.
- There is not significant evidence at alpha =0.05 to show that the populations of birth weights in mothers who smoked in pregnancy and those who did not are not equal.
- There are not enough data points to reach a conclusion.
- The tied value makes the analysis suspect.
U (n+1)_R,=. U2n (n2 +1) _R2= 2+- 2 + 2
Homework Answers

Add Answer to:
2. A small study (n=10) is designed to assess if there is an
association between smoking...
please don't copy. thanks Question 3. In a study measuring the height of birch trees, two...
 please don't copy. thanks
Question 3. In a study measuring the height of birch trees, two types of fertilizer were used. Prior to the study 14 tree's heights were measured. 8 trees were then selected at random to receive a liquid fertilizer during the first summer of the experiment. At the end of the first year their growth was measured. While this was occurring another 6 trees were receiving a granular fertilizer. At the end first year their height was...
please don't copy. thanks
Question 3. In a study measuring the height of birch trees, two types of fertilizer were used. Prior to the study 14 tree's heights were measured. 8 trees were then selected at random to receive a liquid fertilizer during the first summer of the experiment. At the end of the first year their growth was measured. While this was occurring another 6 trees were receiving a granular fertilizer. At the end first year their height was...
Parametirc test or not: Test statistic: p-value: decision: Is There A Difference Between the Means?
Parametirc test or not:Test statistic:p-value:decision:Is There A Difference Between the Means?6.7 6.2 3.1 310.3 10 5 5.56.9 5.5 3.3 3.110.5 6.3 4.3 5.44.5 4.6 1.8 25.6 5.6 2 2.65.9 6.1 2.1 2.58 11.7 4 4.68 7.4 3.3 3.15.8 5.2 3.1 2.96 7.3 3.0 3.28.7 5.3 2.7 36 5.5 2.1 2.27.2 6.3 3.5 3.25.9 4.6 2.9 3.46 7.4 3 3.37.2 7.8 3.7 3.48.6 9.4 5.1 5.77.2 8.1 2.8 3.15.8 5.4 2.2 1.83.3 4 1.7 1.86.8 5.1 2 1.83.7 3.5 2.2 2.112...
Question 3 A researcher is interested in the relationship between the birth weights of infants and mothers' smoking habits. He uses the birth weight of an infant (ounces) and the average n...
 Question 3 A researcher is interested in the relationship between the birth weights of infants and mothers' smoking habits. He uses the birth weight of an infant (ounces) and the average number of cigarettes the mother smokes per day during the pregnancy as the dependent and independent variables, y and x, respectively. Using a sample of size (1388 the following model is obtained by the method of least squares: y-119.770.514.x (3.15) (0.13) SE e the figures in brackets are the...
2. (25pts) Two different brands of latex (water-based) paint are being considered for use in a large construction project. To choose between the brands, one of the key factors is the time it takes th...
 2. (25pts) Two different brands of latex (water-based) paint are being considered for use in a large construction project. To choose between the brands, one of the key factors is the time it takes the paint to dry. Engineers sampled 22 specimens of each brand and measured the drying times (in hours) of each specimen. The data collected are given in Table 1 below Specimen Brand A Brand B Specin Brand A Brand B 3.5 2.7 3.9 4.2 4.6 2.7...
The produce manager at a grocery store claims that Granny Smith apples weight a mean of...
The produce manager at a grocery store claims that Granny Smith apples weight a mean of 4 ounces. (FYI: Granny Smith apples are the green ones.) You are a quality control representative and are testing to see if the claim is reasonable or not. The data below represent a POPULATION of scores from which you are to take a SAMPLE. Your sample size will be ten (10) apples. Your task is to take a sample of 10 scores to test...
10. The Beck & Watson article is a Group of answer choices quantitative study qualitative study...
 10. The Beck & Watson article is a
Group of answer choices
quantitative study
qualitative study
11. Beck & Watson examined participants' experiences and
perceptions using what type of research design?
Group of answer choices
particpant obersvation
phenomenology
12. Select the participants in the Beck & Watson study
Group of answer choices
Caucasian women with 2-4 children
Caucasian pregnant women
13. In the Beck & Watson study, data was collected via
a(n)
Group of answer choices
internet study
focus group...
10. The Beck & Watson article is a
Group of answer choices
quantitative study
qualitative study
11. Beck & Watson examined participants' experiences and
perceptions using what type of research design?
Group of answer choices
particpant obersvation
phenomenology
12. Select the participants in the Beck & Watson study
Group of answer choices
Caucasian women with 2-4 children
Caucasian pregnant women
13. In the Beck & Watson study, data was collected via
a(n)
Group of answer choices
internet study
focus group...
An object of weight 1 N is falling vertically. The time vs. speed data can be...
An object of weight 1 N is falling vertically. The time vs. speed data can be found here. In this case the effect of air-drag cannot be neglected. Use your critical thinking to estimate the air-drag coefficient . Make sure you include the units in your answer. 0 0 0.1 0.9992 0.2 1.993 0.3 2.978 0.4 3.948 0.5 4.898 0.6 5.826 0.7 6.728 0.8 7.599 0.9 8.438 1 9.242 1.1 10.01 1.2 10.74 1.3 11.43 1.4 12.09 1.5 12.7 1.6 ...
• 1. What are the quarterly growth rates (Percentage Change From Preceding Period in Real Gross...
 • 1. What are the quarterly growth rates (Percentage Change From Preceding Period in Real Gross Domestic Product) for the U.S. economy for the last six quarters? Report those numbers in your submission 2. What is the average of those 6 quarters? . 3. Is the average of those growth rates above or below the long-run U.S. annual growth rate of 3.5 percent? Bureau of Economke Analysis Table 1.1.1. Percent Change From Preceding Period in Real Gross Domestic Product Percent...
I need to match these ten industries using Exhibit 3: For example, Electrical Utility is #8 and Retail Grocery is #7. Pl...
 I need to match these ten industries using Exhibit 3: For
example, Electrical Utility is #8 and Retail Grocery is #7. Please
help! Thanks. I have 7 confirmed these are:
Each of the 10 publicly traded companies in Exhibit 3 is drawn
from one of the following industries (listed below in random
order):
I have 7 confirmed these are:
1. Management consulting services
2.
3. Data processing and camera
applications services
4. Electronic, aerospace, communication, sensor
systems
5. Hospital and...
I need to match these ten industries using Exhibit 3: For
example, Electrical Utility is #8 and Retail Grocery is #7. Please
help! Thanks. I have 7 confirmed these are:
Each of the 10 publicly traded companies in Exhibit 3 is drawn
from one of the following industries (listed below in random
order):
I have 7 confirmed these are:
1. Management consulting services
2.
3. Data processing and camera
applications services
4. Electronic, aerospace, communication, sensor
systems
5. Hospital and...
We consider a multiple linear regression model with LIFE (y) as the response variable, and MALE (...
 We consider a multiple linear regression model with LIFE (y) as
the response variable, and MALE (x1), BIRTH (x2), DIVO (x3), BEDS
(x4), EDUC (x5), and INCO (x6), as predictors.
"STATE" "MALE" "BIRTH" "DIVO" "BEDS" "EDUC" "INCO" "LIFE"
AK 119.1 24.8 5.6 603.3 14.1 4638 69.31
AL 93.3 19.4 4.4 840.9 7.8 2892 69.05
AR 94.1 18.5 4.8 569.6 6.7 2791 70.66
AZ 96.8 21.2 7.2 536.0 12.6 3614 70.55
CA 96.8 18.2 5.7 649.5 13.4 4423 71.71
CO 97.5...
We consider a multiple linear regression model with LIFE (y) as
the response variable, and MALE (x1), BIRTH (x2), DIVO (x3), BEDS
(x4), EDUC (x5), and INCO (x6), as predictors.
"STATE" "MALE" "BIRTH" "DIVO" "BEDS" "EDUC" "INCO" "LIFE"
AK 119.1 24.8 5.6 603.3 14.1 4638 69.31
AL 93.3 19.4 4.4 840.9 7.8 2892 69.05
AR 94.1 18.5 4.8 569.6 6.7 2791 70.66
AZ 96.8 21.2 7.2 536.0 12.6 3614 70.55
CA 96.8 18.2 5.7 649.5 13.4 4423 71.71
CO 97.5...
 please don't copy. thanks
Question 3. In a study measuring the height of birch trees, two types of fertilizer were used. Prior to the study 14 tree's heights were measured. 8 trees were then selected at random to receive a liquid fertilizer during the first summer of the experiment. At the end of the first year their growth was measured. While this was occurring another 6 trees were receiving a granular fertilizer. At the end first year their height was...
please don't copy. thanks
Question 3. In a study measuring the height of birch trees, two types of fertilizer were used. Prior to the study 14 tree's heights were measured. 8 trees were then selected at random to receive a liquid fertilizer during the first summer of the experiment. At the end of the first year their growth was measured. While this was occurring another 6 trees were receiving a granular fertilizer. At the end first year their height was...
 Question 3 A researcher is interested in the relationship between the birth weights of infants and mothers' smoking habits. He uses the birth weight of an infant (ounces) and the average number of cigarettes the mother smokes per day during the pregnancy as the dependent and independent variables, y and x, respectively. Using a sample of size (1388 the following model is obtained by the method of least squares: y-119.770.514.x (3.15) (0.13) SE e the figures in brackets are the...
 2. (25pts) Two different brands of latex (water-based) paint are being considered for use in a large construction project. To choose between the brands, one of the key factors is the time it takes the paint to dry. Engineers sampled 22 specimens of each brand and measured the drying times (in hours) of each specimen. The data collected are given in Table 1 below Specimen Brand A Brand B Specin Brand A Brand B 3.5 2.7 3.9 4.2 4.6 2.7...
 10. The Beck & Watson article is a
Group of answer choices
quantitative study
qualitative study
11. Beck & Watson examined participants' experiences and
perceptions using what type of research design?
Group of answer choices
particpant obersvation
phenomenology
12. Select the participants in the Beck & Watson study
Group of answer choices
Caucasian women with 2-4 children
Caucasian pregnant women
13. In the Beck & Watson study, data was collected via
a(n)
Group of answer choices
internet study
focus group...
10. The Beck & Watson article is a
Group of answer choices
quantitative study
qualitative study
11. Beck & Watson examined participants' experiences and
perceptions using what type of research design?
Group of answer choices
particpant obersvation
phenomenology
12. Select the participants in the Beck & Watson study
Group of answer choices
Caucasian women with 2-4 children
Caucasian pregnant women
13. In the Beck & Watson study, data was collected via
a(n)
Group of answer choices
internet study
focus group...
 • 1. What are the quarterly growth rates (Percentage Change From Preceding Period in Real Gross Domestic Product) for the U.S. economy for the last six quarters? Report those numbers in your submission 2. What is the average of those 6 quarters? . 3. Is the average of those growth rates above or below the long-run U.S. annual growth rate of 3.5 percent? Bureau of Economke Analysis Table 1.1.1. Percent Change From Preceding Period in Real Gross Domestic Product Percent...
 I need to match these ten industries using Exhibit 3: For
example, Electrical Utility is #8 and Retail Grocery is #7. Please
help! Thanks. I have 7 confirmed these are:
Each of the 10 publicly traded companies in Exhibit 3 is drawn
from one of the following industries (listed below in random
order):
I have 7 confirmed these are:
1. Management consulting services
2.
3. Data processing and camera
applications services
4. Electronic, aerospace, communication, sensor
systems
5. Hospital and...
I need to match these ten industries using Exhibit 3: For
example, Electrical Utility is #8 and Retail Grocery is #7. Please
help! Thanks. I have 7 confirmed these are:
Each of the 10 publicly traded companies in Exhibit 3 is drawn
from one of the following industries (listed below in random
order):
I have 7 confirmed these are:
1. Management consulting services
2.
3. Data processing and camera
applications services
4. Electronic, aerospace, communication, sensor
systems
5. Hospital and...
 We consider a multiple linear regression model with LIFE (y) as
the response variable, and MALE (x1), BIRTH (x2), DIVO (x3), BEDS
(x4), EDUC (x5), and INCO (x6), as predictors.
"STATE" "MALE" "BIRTH" "DIVO" "BEDS" "EDUC" "INCO" "LIFE"
AK 119.1 24.8 5.6 603.3 14.1 4638 69.31
AL 93.3 19.4 4.4 840.9 7.8 2892 69.05
AR 94.1 18.5 4.8 569.6 6.7 2791 70.66
AZ 96.8 21.2 7.2 536.0 12.6 3614 70.55
CA 96.8 18.2 5.7 649.5 13.4 4423 71.71
CO 97.5...
We consider a multiple linear regression model with LIFE (y) as
the response variable, and MALE (x1), BIRTH (x2), DIVO (x3), BEDS
(x4), EDUC (x5), and INCO (x6), as predictors.
"STATE" "MALE" "BIRTH" "DIVO" "BEDS" "EDUC" "INCO" "LIFE"
AK 119.1 24.8 5.6 603.3 14.1 4638 69.31
AL 93.3 19.4 4.4 840.9 7.8 2892 69.05
AR 94.1 18.5 4.8 569.6 6.7 2791 70.66
AZ 96.8 21.2 7.2 536.0 12.6 3614 70.55
CA 96.8 18.2 5.7 649.5 13.4 4423 71.71
CO 97.5...
Most questions answered within 3 hours.
-
Where is the error in this code sequence?
String s1 = "Hello";
String s2 = "ello";...
asked 10 months ago -
Financial data for Joel de Paris, Inc., for last year
follow:
Joel de Paris, Inc.
Balance...
asked 10 months ago -
Consider this reaction:
Al2(SO4)3 (aq)+ BaCl3
(aq) Al2Cl6 (aq)- +
3BaSO4(s) . What is the...
asked 10 months ago -
Suppose that Savneet is considering increasing her
recent random sample from 20 car rentals to 40...
asked 10 months ago -
Trucks arrive at an unloading terminal at an average rate of 120
per hour.
Trucks arrive...
asked 10 months ago -
Why are methanol and ethanol completely soluble in water while
octanol is not very little soluble....
asked 10 months ago -
A facilities manager at a university reads in a research report
that the mean amount of...
asked 10 months ago -
When the CuSO4 is rehydrated by adding water to the anhydrous
compound, is this an endothermic...
asked 10 months ago -
A ray of sunlight is passing from diamond into crown glass; the
angle of incidence is...
asked 10 months ago -
A block of mass 0.249 kg is placed on top of a light, vertical
spring of...
asked 10 months ago -
how do the kidneys compensate in the presences of acidosis
a) trigger hyperventilate
b) reserve acid...
asked 10 months ago -
Question 501 pts
The rental rate of capital to the firm increases. Which of the
following...
asked 10 months ago