R programming:

MPG GPM WT DIS
NC HP ACC ET
16.9 5.917 4.360
350 8 155 14.9
1
15.5 6.452 4.054
351 8 142 14.3
1
19.2 5.208 3.605
267 8 125 15.0
1
18.5 5.405 3.940
360 8 150 13.0
1
30.0 3.333 2.155 98
4 68 16.5 0
27.5 3.636 2.560
134 4 95 14.2
0
27.2 3.676 2.300
119 4 97 14.7
0
30.9 3.236 2.230
105 4 75 14.5
0
20.3 4.926 2.830
131 5 103 15.9
0
17.0 5.882 3.140
163 6 125 13.6
0
21.6 4.630 2.795
121 4 115 15.7
0
16.2 6.173 3.410
163 6 133 15.8
0
20.6 4.854 3.380
231 6 105 15.8
0
20.8 4.808 3.070
200 6 85 16.7
0
18.6 5.376 3.620
225 6 110 18.7
0
18.1 5.525 3.410
258 6 120 15.1
0
17.0 5.882 3.840
305 8 130 15.4
1
17.6 5.682 3.725
302 8 129 13.4
1
16.5 6.061 3.955
351 8 138 13.2
1
18.2 5.495 3.830
318 8 135 15.2
1
26.5 3.774 2.585
140 4 88 14.4
0
21.9 4.566 2.910
171 6 109 16.6
1
34.1 2.933 1.975 86
4 65 15.2 0
35.1 2.849 1.915 98
4 80 14.4 0
27.4 3.650 2.670
121 4 80 15.0
0
31.5 3.175 1.990 89
4 71 14.9 0
29.5 3.390 2.135 98
4 68 16.6 0
28.4 3.521 2.670
151 4 90 16.0
0
28.8 3.472 2.595
173 6 115 11.3
1
26.8 3.731 2.700
173 6 115 12.9
1
33.5 2.985 2.556
151 4 90 13.2
0
34.2 2.924 2.200
105 4 70 13.2
0
31.8 3.145 2.020 85
4 65 19.2 0
37.3 2.681 2.130 91
4 69 14.7 0
30.5 3.279 2.190 97
4 78 14.1 0
22.0 4.545 2.815
146 6 97 14.5
0
21.5 4.651 2.600
121 4 110 12.8
0
31.9 3.135 1.925 89
4 71 14.0 0
Homework Answers
a)
## To import the dataset select the file after running the below command
data_20Jan = read.csv(file.choose(),header = T)
head(data_20Jan)
# Boxplot of MPG by Car Cylinders
boxplot(MPG~ET,data=data_20Jan, main="Car Milage Data",
xlab="Car Type", ylab="Miles Per Gallon")

b)
This part cannot be done with the description of the column names of the dataset
c)
#MPG = Y , WT = X
regmodel <- lm(MPG ~ WT, data = data_20Jan)
summary(regmodel)
Output
Call:
lm(formula = MPG ~ WT, data = data_20Jan)
Residuals:
Min 1Q Median 3Q Max
-5.4595 -1.9004 0.1686 1.4032 6.4091
Coefficients:
Estimate Std. Error t value Pr(>|t|)
(Intercept) 48.708 1.954 24.93 < 2e-16 ***
WT -8.365 0.663 -12.62 8.89e-15 ***
---
Signif. codes: 0 ‘***’ 0.001 ‘**’ 0.01 ‘*’ 0.05 ‘.’ 0.1 ‘ ’ 1
Residual standard error: 2.851 on 36 degrees of freedom
Multiple R-squared: 0.8155, Adjusted R-squared: 0.8104
F-statistic: 159.2 on 1 and 36 DF, p-value: 8.889e-15
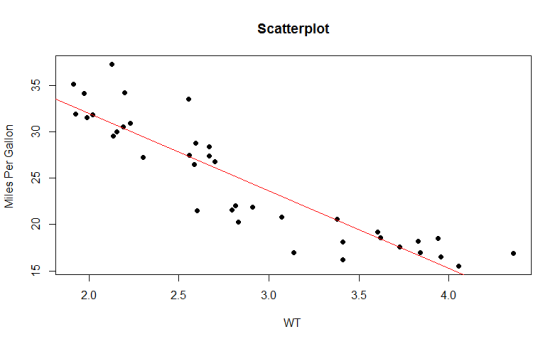
d)
plot(data_20Jan$WT, data_20Jan$MPG, main="Scatterplot",
xlab="WT ", ylab="Miles Per Gallon ", pch=19)
# Add fit lines
abline(lm(data_20Jan$MPG~data_20Jan$WT), col="red") # regression line (y~x)
e)
Output
Call:
lm(formula = MPG ~ WT, data = data_20Jan)
Residuals:
Min 1Q Median 3Q Max
-5.4595 -1.9004 0.1686 1.4032 6.4091
Coefficients:
Estimate Std. Error t value Pr(>|t|)
(Intercept) 48.708 1.954 24.93 < 2e-16 ***
WT -8.365 0.663 -12.62 8.89e-15 ***
---
Signif. codes: 0 ‘***’ 0.001 ‘**’ 0.01 ‘*’ 0.05 ‘.’ 0.1 ‘ ’ 1
Residual standard error: 2.851 on 36 degrees of freedom
Multiple R-squared: 0.8155, Adjusted R-squared: 0.8104
F-statistic: 159.2 on 1 and 36 DF, p-value: 8.889e-15
Regression Equation
MPG = 48.708 – 8.365 WT
Interpretation of Slope:
The amount by which the response variable (MPG) increases or decreases, on average, when the explanatory variable (WT) increases by one.
The y intercept is the value at which the fitted line crosses the y-axis. In this case, its value is 48.708. ie when WT is zero, MPG is 48.708 units.
f)
95% CI for Slope = -8.365 +/- 1.96 * 0.663 = {-9.66, -7.07}
95% CI for Intercept = 48.708 +/- 1.96 * 1.954 = {44.88, 52.54}
g)
SSRegression = 1,293.52
SSResidual = 292.58
SSTotal = SSRegression +SSResidual = 1,586.09
Add Answer to:
R programming:
MPG GPM WT DIS
NC HP ACC ET
16.9 5.917 4.360
350 8 155 ...
R programming: MPG GPM WT DIS NC HP ACC ET 16.9 5.917 4.360 350 8 155 ...
 R programming:
MPG GPM WT DIS
NC HP ACC ET
16.9 5.917 4.360
350 8 155 14.9
1
15.5 6.452 4.054
351 8 142 14.3
1
19.2 5.208 3.605
267 8 125 15.0
1
18.5 5.405 3.940
360 8 150 13.0
1
30.0 3.333 2.155 98
4 68 16.5 0
27.5 3.636 2.560
134 4 95 14.2
0
27.2 3.676 2.300
119 4 97 14.7
0
30.9 3.236 2.230
105 4 75 14.5
0
20.3 4.926 2.830
131 5 103 ...
R programming:
MPG GPM WT DIS
NC HP ACC ET
16.9 5.917 4.360
350 8 155 14.9
1
15.5 6.452 4.054
351 8 142 14.3
1
19.2 5.208 3.605
267 8 125 15.0
1
18.5 5.405 3.940
360 8 150 13.0
1
30.0 3.333 2.155 98
4 68 16.5 0
27.5 3.636 2.560
134 4 95 14.2
0
27.2 3.676 2.300
119 4 97 14.7
0
30.9 3.236 2.230
105 4 75 14.5
0
20.3 4.926 2.830
131 5 103 ...
The data file Motor Trend is a random sample of 32 automobiles. The miles per gallon ...
The data file Motor Trend is a random sample of 32 automobiles. The miles per gallon (mpg), weight (wt), horsepower (hp) and type of transmission (manual or automatic) is recorded for each sampled automobile. The file is available on Blackboard. Transmission is a categorical variable. Code the variable transmission so that it can be used in a regression model. Your coding should assign a 1 to manual transmission and a 0 to automatic. Develop a regression model with mpg as...
PLEASE USE THE BELOW GIVEN DATA TO SOLVE THIS PROBLEM. INCLUDING THE BRIEF REPORT. THANK YOU....
 PLEASE USE THE BELOW GIVEN DATA TO SOLVE THIS PROBLEM. INCLUDING
THE BRIEF REPORT.
THANK YOU.
Sales (Y)
Calls (X1)
Time (X2)
Years (X3)
Type
47
167
12.9
5
ONLINE
47
167
16.1
5
ONLINE
44
165
14.2
5
GROUP
43
137
16.6
4
NONE
34
184
12.5
4
GROUP
36
173
14.3
4
GROUP
44
160
14.1
4
NONE
34
132
18.2
4
NONE
48
182
14.1
4
ONLINE
41
158
13.8
4
GROUP
38
163
10.8
4
GROUP...
PLEASE USE THE BELOW GIVEN DATA TO SOLVE THIS PROBLEM. INCLUDING
THE BRIEF REPORT.
THANK YOU.
Sales (Y)
Calls (X1)
Time (X2)
Years (X3)
Type
47
167
12.9
5
ONLINE
47
167
16.1
5
ONLINE
44
165
14.2
5
GROUP
43
137
16.6
4
NONE
34
184
12.5
4
GROUP
36
173
14.3
4
GROUP
44
160
14.1
4
NONE
34
132
18.2
4
NONE
48
182
14.1
4
ONLINE
41
158
13.8
4
GROUP
38
163
10.8
4
GROUP...
We are interested in the relationship between the compensation of Chief Executive Officers (CEO) ...
We are interested in the relationship between the compensation of Chief Executive Officers (CEO) of firms and the return on equity of their respective firm, using the dataset below. The variable salary shows the annual salary of a CEO in thousands of dollars, so that y = 150 indicates a salary of $150,000. Similarly, the variable ROE represents the average return on equity (ROE)for the CEO’s firm for the previous three years. A ROE of 20 indicates an average return...
find v belt drive design power select belt type determine shive size (belt speed 4000 ft/min)...
 find v belt drive
design power
select belt type
determine shive size (belt speed 4000 ft/min)
find shive size from power rating figure
find rated power
find estimated centre distance
find belt length (by selecting standard belt length)
calculate actual centre distance
find contact angle for small shieve
determine correct factors
calculate correct power per belt
no. of belt needed
V-Belt Designing Sample Problem . Given: A 4 cylinder diesel engine runs at 80 hp, 1800 rpm, to drive a...
find v belt drive
design power
select belt type
determine shive size (belt speed 4000 ft/min)
find shive size from power rating figure
find rated power
find estimated centre distance
find belt length (by selecting standard belt length)
calculate actual centre distance
find contact angle for small shieve
determine correct factors
calculate correct power per belt
no. of belt needed
V-Belt Designing Sample Problem . Given: A 4 cylinder diesel engine runs at 80 hp, 1800 rpm, to drive a...
Problem #1: TO SELECT THE MOST ECONOMICAL Wio SHAPE COLUMN ZO FEET IN HEIGHT SUPPORT AH...
 Problem #1: TO SELECT THE MOST ECONOMICAL Wio SHAPE COLUMN ZO FEET IN HEIGHT SUPPORT AH AXIAL LORD OF 370 KIPS using soksi STEEL! ASSUME A FIXED BASE ANDA PINGED TOP (CASE C) WIDE FLANGE SHAPES HP Axis Y-Y Theoretical Dimensions and Properties for Designing Flange Axis X-X | Weight Area Depth Web Section per of of Thick- Thick- Number Foot Section Section Width S 'T Sy Ty ness ness < * A by tw in. in. in.' in. in....
If the two signal handling functions in 3000pc were replaced by one function, would there be...
If the two signal handling functions in 3000pc were replaced by one function, would there be any significant loss of functionality? Briefly explain /* 3000pc.c */ 2 3 4 5 6 7 8 #include <stdio.h> 9 #include <stdlib.h> 10 #include <unistd.h> 11 #include <sys/mman.h> 12 #include <errno.h> 13 #include <string.h> 14 #include <sys/types.h> 15 #include <sys/wait.h> 16 #include <semaphore.h> 17 #include <string.h> 18 #include <time.h> 19 20 #define QUEUESIZE 32 21 #define WORDSIZE 16 22 23 const int wordlist_size =...
CASE 1-5 Financial Statement Ratio Computation Refer to Campbell Soup Company's financial Campbell Soup statements in...
 CASE 1-5 Financial Statement Ratio Computation Refer to Campbell Soup Company's financial Campbell Soup statements in Appendix A. Required: Compute the following ratios for Year 11. Liquidity ratios: Asset utilization ratios:* a. Current ratio n. Cash turnover b. Acid-test ratio 0. Accounts receivable turnover c. Days to sell inventory p. Inventory turnover d. Collection period 4. Working capital turnover Capital structure and solvency ratios: 1. Fixed assets turnover e. Total debt to total equity s. Total assets turnover f. Long-term...
 R programming:
MPG GPM WT DIS
NC HP ACC ET
16.9 5.917 4.360
350 8 155 14.9
1
15.5 6.452 4.054
351 8 142 14.3
1
19.2 5.208 3.605
267 8 125 15.0
1
18.5 5.405 3.940
360 8 150 13.0
1
30.0 3.333 2.155 98
4 68 16.5 0
27.5 3.636 2.560
134 4 95 14.2
0
27.2 3.676 2.300
119 4 97 14.7
0
30.9 3.236 2.230
105 4 75 14.5
0
20.3 4.926 2.830
131 5 103 ...
R programming:
MPG GPM WT DIS
NC HP ACC ET
16.9 5.917 4.360
350 8 155 14.9
1
15.5 6.452 4.054
351 8 142 14.3
1
19.2 5.208 3.605
267 8 125 15.0
1
18.5 5.405 3.940
360 8 150 13.0
1
30.0 3.333 2.155 98
4 68 16.5 0
27.5 3.636 2.560
134 4 95 14.2
0
27.2 3.676 2.300
119 4 97 14.7
0
30.9 3.236 2.230
105 4 75 14.5
0
20.3 4.926 2.830
131 5 103 ...
 PLEASE USE THE BELOW GIVEN DATA TO SOLVE THIS PROBLEM. INCLUDING
THE BRIEF REPORT.
THANK YOU.
Sales (Y)
Calls (X1)
Time (X2)
Years (X3)
Type
47
167
12.9
5
ONLINE
47
167
16.1
5
ONLINE
44
165
14.2
5
GROUP
43
137
16.6
4
NONE
34
184
12.5
4
GROUP
36
173
14.3
4
GROUP
44
160
14.1
4
NONE
34
132
18.2
4
NONE
48
182
14.1
4
ONLINE
41
158
13.8
4
GROUP
38
163
10.8
4
GROUP...
PLEASE USE THE BELOW GIVEN DATA TO SOLVE THIS PROBLEM. INCLUDING
THE BRIEF REPORT.
THANK YOU.
Sales (Y)
Calls (X1)
Time (X2)
Years (X3)
Type
47
167
12.9
5
ONLINE
47
167
16.1
5
ONLINE
44
165
14.2
5
GROUP
43
137
16.6
4
NONE
34
184
12.5
4
GROUP
36
173
14.3
4
GROUP
44
160
14.1
4
NONE
34
132
18.2
4
NONE
48
182
14.1
4
ONLINE
41
158
13.8
4
GROUP
38
163
10.8
4
GROUP...
 find v belt drive
design power
select belt type
determine shive size (belt speed 4000 ft/min)
find shive size from power rating figure
find rated power
find estimated centre distance
find belt length (by selecting standard belt length)
calculate actual centre distance
find contact angle for small shieve
determine correct factors
calculate correct power per belt
no. of belt needed
V-Belt Designing Sample Problem . Given: A 4 cylinder diesel engine runs at 80 hp, 1800 rpm, to drive a...
find v belt drive
design power
select belt type
determine shive size (belt speed 4000 ft/min)
find shive size from power rating figure
find rated power
find estimated centre distance
find belt length (by selecting standard belt length)
calculate actual centre distance
find contact angle for small shieve
determine correct factors
calculate correct power per belt
no. of belt needed
V-Belt Designing Sample Problem . Given: A 4 cylinder diesel engine runs at 80 hp, 1800 rpm, to drive a...
 Problem #1: TO SELECT THE MOST ECONOMICAL Wio SHAPE COLUMN ZO FEET IN HEIGHT SUPPORT AH AXIAL LORD OF 370 KIPS using soksi STEEL! ASSUME A FIXED BASE ANDA PINGED TOP (CASE C) WIDE FLANGE SHAPES HP Axis Y-Y Theoretical Dimensions and Properties for Designing Flange Axis X-X | Weight Area Depth Web Section per of of Thick- Thick- Number Foot Section Section Width S 'T Sy Ty ness ness < * A by tw in. in. in.' in. in....
 CASE 1-5 Financial Statement Ratio Computation Refer to Campbell Soup Company's financial Campbell Soup statements in Appendix A. Required: Compute the following ratios for Year 11. Liquidity ratios: Asset utilization ratios:* a. Current ratio n. Cash turnover b. Acid-test ratio 0. Accounts receivable turnover c. Days to sell inventory p. Inventory turnover d. Collection period 4. Working capital turnover Capital structure and solvency ratios: 1. Fixed assets turnover e. Total debt to total equity s. Total assets turnover f. Long-term...
Most questions answered within 3 hours.
-
Where is the error in this code sequence?
String s1 = "Hello";
String s2 = "ello";...
asked 10 months ago -
Financial data for Joel de Paris, Inc., for last year
follow:
Joel de Paris, Inc.
Balance...
asked 10 months ago -
Consider this reaction:
Al2(SO4)3 (aq)+ BaCl3
(aq) Al2Cl6 (aq)- +
3BaSO4(s) . What is the...
asked 10 months ago -
Suppose that Savneet is considering increasing her
recent random sample from 20 car rentals to 40...
asked 10 months ago -
Trucks arrive at an unloading terminal at an average rate of 120
per hour.
Trucks arrive...
asked 10 months ago -
Why are methanol and ethanol completely soluble in water while
octanol is not very little soluble....
asked 10 months ago -
A facilities manager at a university reads in a research report
that the mean amount of...
asked 10 months ago -
When the CuSO4 is rehydrated by adding water to the anhydrous
compound, is this an endothermic...
asked 10 months ago -
A ray of sunlight is passing from diamond into crown glass; the
angle of incidence is...
asked 10 months ago -
A block of mass 0.249 kg is placed on top of a light, vertical
spring of...
asked 10 months ago -
how do the kidneys compensate in the presences of acidosis
a) trigger hyperventilate
b) reserve acid...
asked 10 months ago -
Question 501 pts
The rental rate of capital to the firm increases. Which of the
following...
asked 10 months ago