

Homework Answers

Add Answer to:
TABLE 2.12 DATA FOR 82 OF THE MOST VALUABLE BRANDS Brand Value 1-Yr Value Industry Other...
those pictures are for the one question, please answer all of them. Thanks! eBook Each year...
 those pictures are for the one question, please answer all of
them. Thanks!
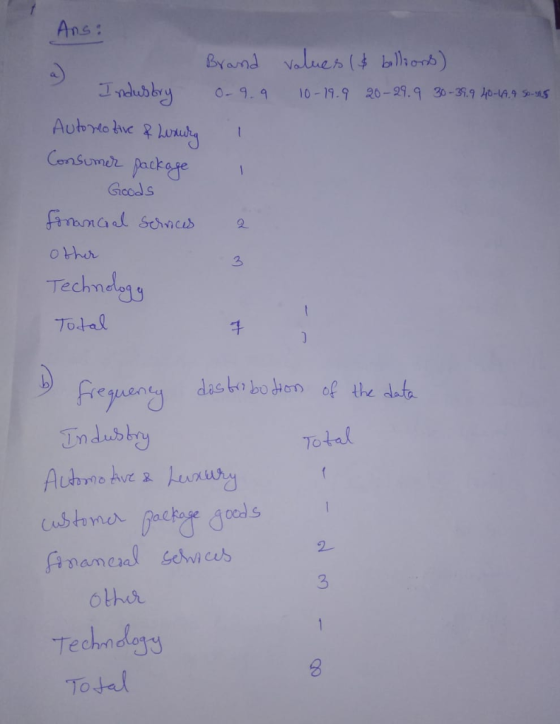
eBook Each year Forbes ranks the world's most valuable brands. A portion of the data for 82 of the brands in the 2013 Forbes list is shown in Table 2.12 (Forbes website, February, 2014), The data set includes the following varlables: The name of the brand The type of Industry assoclated with the brand, labeled Automotive & LuxuryY, Consumer Packaged Goods, Financial Services, Other, Technology A measure...
those pictures are for the one question, please answer all of
them. Thanks!
eBook Each year Forbes ranks the world's most valuable brands. A portion of the data for 82 of the brands in the 2013 Forbes list is shown in Table 2.12 (Forbes website, February, 2014), The data set includes the following varlables: The name of the brand The type of Industry assoclated with the brand, labeled Automotive & LuxuryY, Consumer Packaged Goods, Financial Services, Other, Technology A measure...
Bhtpeng.cengage.com/sal Q Search this course CENGAGE MINDTAP Chapter 2 Assignment Each year Forbes ranks the world's...
 Bhtpeng.cengage.com/sal Q Search this course CENGAGE MINDTAP Chapter 2 Assignment Each year Forbes ranks the world's most valuable brands. A portion of the data for 82 of the brands in the 2013 Forbes list is shown in Table 2.12 (Forbes website, February, 2014). The data set includes the following variables: cBooks The name of the brand. Brands 10 The type of industry assocated with the beand, Iabeled Automotive & Luxury, Consumer Packaged Goods Industry Financial Services, Other, Technology. A measure...
Question 2: An oil company produces three brands of oil: regular, multigrade, and supreme. Each brand...
 Question 2: An oil company produces three brands of oil: regular, multigrade, and supreme. Each brand of oil is composed of one or more of four crude stocks, each having a different lubrication index. The relevant data concerning the crude stocks are as follows. Crude Stock Lubrication Index Cost/Barrel Daily Supply (Barrels) 20 40 30 7.10 8.50 7.70 9.00 1000 1100 1200 1100 3 Each brand of oil must meet a minimum standard for a lubrication index, and each brand...
[36 marks] Each year, the business magazine Forbes publishes an annual ranking of the world’s most...
[36 marks] Each year, the business magazine Forbes publishes an annual ranking of the world’s most powerful or valuable brands. The 2018 Ranking of the Top 100 brands is given at the following webpage. https://www.forbes.com/powerful-brands/list Download this data into a suitable spreadsheet. Please do not spend money, careful copy/paste will do. [7 marks] State and classify the level of measurement for each variable in this data set. [8 marks] Prepare descriptive statistics tables with a comprehensive list of several numerical...
Data Table 2: Titration Curve Values pH Value Trial 1 pH Value Trial 2 pH Value...
 Data Table 2: Titration Curve Values pH Value Trial 1 pH Value Trial 2 pH Value (Average) Drops NaOH Added Half- Equivalence Point Equivalence Point ? ? ? ? ? ? 0 2.5 2.5 2.5 10 4.5 4.5 4.5 20 4.5 4.5 4.5 30 4.5 4.5 4.5 40 4.5 4.5 4.5 50 O7 5 5 60 5.5 5.5 5.5 70 6 6.5 6.25 80 12.5 13 12.75 90 13.5 13.5 13.5 100 13.5 13.5 13.5 110 14 14 14 120...
The following table shows a data set containing information for 25 of the shadow stocks tracked...
 The following table shows a data set containing information for 25 of the shadow stocks tracked by the American Association of Individual Investors. Shadow stocks are common stocks of smaller companies that are not closely followed by Wall Street analysts. Click on the datafile logo to reference the data DATA file Excel or Minitab users: The data set is available in the file named Shadow02. Al data sets can be found on the premium online website Profit Earnings Margin Price/...
aren 8, 2012) rer these data In eerose 20, data on x-weght(pounds) and y-price ($) for...
 aren 8, 2012) rer these data In eerose 20, data on x-weght(pounds) and y-price ($) for ten roed-racing bikes provided the estimated regression equation SSE 7,102,922.54 and SST-52,120,800. Use the F test to determine whether the weight for data -28574-1435xくBicycling website, M a bike and the price are related at the 05 level of significance. Click on the webfile logo to reference the WEB Calculate the value of the test stotistic (to 1 decimal) 1.4 The p value is ess...
Can you please answers these four questions as aoin as possible please and thank you! Given...
 Can you please answers these four questions as aoin as
possible please and thank you!
Given are five observations for two variables, z and y 5 13 20 18 48 57 11 27 a. Choose the corre rect scatter diagram for these data: A. B. 60+ 60 50 50 40 40 30+ 30 20 20 10 10- 10 20 30 40 50 60 x 10 20 30 40 50 60 57 x y 60 60 50+ 50- 40- 40+ 30-...
Can you please answers these four questions as aoin as
possible please and thank you!
Given are five observations for two variables, z and y 5 13 20 18 48 57 11 27 a. Choose the corre rect scatter diagram for these data: A. B. 60+ 60 50 50 40 40 30+ 30 20 20 10 10- 10 20 30 40 50 60 x 10 20 30 40 50 60 57 x y 60 60 50+ 50- 40- 40+ 30-...
Young Brands OUNG BRANDS (YB) is a manufacturer of sports clothing and team uniforms. Its industry...
 Young Brands OUNG BRANDS (YB) is a manufacturer of sports clothing and team uniforms. Its industry is quite competitive, so the management team has attempted to operate a modern operation with state-of-the-art production facilities. Careful cost management has been an important factor in attaining profits. YB is considered a leader for its fashion sense, pricing, market- ing, and product quality. Professional and university-team uniforms and affiliated products are sold by company salesmen to teams and to retail stores throughout North...
2) For Nescafe Taster's Choice, what is the projected variable cost of coffee beans for a 100-cup...
 2) For Nescafe Taster's Choice, what is the projected variable
cost of coffee
beans for a 100-cup jar if you decide to use the FLO Fairtrade mark
for
Farmers Blend?
$5.82
$4.66
$2.91
$2.33
$2.00
Your team has gathered the following information to assist with your decision. Farmers Blend would launch in 100-cup jars (standard size) O Regardless of branding choices, S5 million for advertising and promotions should produce 40% awareness among instant coffee drinkers and 60% ACV distribution I...
2) For Nescafe Taster's Choice, what is the projected variable
cost of coffee
beans for a 100-cup jar if you decide to use the FLO Fairtrade mark
for
Farmers Blend?
$5.82
$4.66
$2.91
$2.33
$2.00
Your team has gathered the following information to assist with your decision. Farmers Blend would launch in 100-cup jars (standard size) O Regardless of branding choices, S5 million for advertising and promotions should produce 40% awareness among instant coffee drinkers and 60% ACV distribution I...
 those pictures are for the one question, please answer all of
them. Thanks!
eBook Each year Forbes ranks the world's most valuable brands. A portion of the data for 82 of the brands in the 2013 Forbes list is shown in Table 2.12 (Forbes website, February, 2014), The data set includes the following varlables: The name of the brand The type of Industry assoclated with the brand, labeled Automotive & LuxuryY, Consumer Packaged Goods, Financial Services, Other, Technology A measure...
those pictures are for the one question, please answer all of
them. Thanks!
eBook Each year Forbes ranks the world's most valuable brands. A portion of the data for 82 of the brands in the 2013 Forbes list is shown in Table 2.12 (Forbes website, February, 2014), The data set includes the following varlables: The name of the brand The type of Industry assoclated with the brand, labeled Automotive & LuxuryY, Consumer Packaged Goods, Financial Services, Other, Technology A measure...
 Bhtpeng.cengage.com/sal Q Search this course CENGAGE MINDTAP Chapter 2 Assignment Each year Forbes ranks the world's most valuable brands. A portion of the data for 82 of the brands in the 2013 Forbes list is shown in Table 2.12 (Forbes website, February, 2014). The data set includes the following variables: cBooks The name of the brand. Brands 10 The type of industry assocated with the beand, Iabeled Automotive & Luxury, Consumer Packaged Goods Industry Financial Services, Other, Technology. A measure...
 Question 2: An oil company produces three brands of oil: regular, multigrade, and supreme. Each brand of oil is composed of one or more of four crude stocks, each having a different lubrication index. The relevant data concerning the crude stocks are as follows. Crude Stock Lubrication Index Cost/Barrel Daily Supply (Barrels) 20 40 30 7.10 8.50 7.70 9.00 1000 1100 1200 1100 3 Each brand of oil must meet a minimum standard for a lubrication index, and each brand...
 Data Table 2: Titration Curve Values pH Value Trial 1 pH Value Trial 2 pH Value (Average) Drops NaOH Added Half- Equivalence Point Equivalence Point ? ? ? ? ? ? 0 2.5 2.5 2.5 10 4.5 4.5 4.5 20 4.5 4.5 4.5 30 4.5 4.5 4.5 40 4.5 4.5 4.5 50 O7 5 5 60 5.5 5.5 5.5 70 6 6.5 6.25 80 12.5 13 12.75 90 13.5 13.5 13.5 100 13.5 13.5 13.5 110 14 14 14 120...
 The following table shows a data set containing information for 25 of the shadow stocks tracked by the American Association of Individual Investors. Shadow stocks are common stocks of smaller companies that are not closely followed by Wall Street analysts. Click on the datafile logo to reference the data DATA file Excel or Minitab users: The data set is available in the file named Shadow02. Al data sets can be found on the premium online website Profit Earnings Margin Price/...
 aren 8, 2012) rer these data In eerose 20, data on x-weght(pounds) and y-price ($) for ten roed-racing bikes provided the estimated regression equation SSE 7,102,922.54 and SST-52,120,800. Use the F test to determine whether the weight for data -28574-1435xくBicycling website, M a bike and the price are related at the 05 level of significance. Click on the webfile logo to reference the WEB Calculate the value of the test stotistic (to 1 decimal) 1.4 The p value is ess...
 Can you please answers these four questions as aoin as
possible please and thank you!
Given are five observations for two variables, z and y 5 13 20 18 48 57 11 27 a. Choose the corre rect scatter diagram for these data: A. B. 60+ 60 50 50 40 40 30+ 30 20 20 10 10- 10 20 30 40 50 60 x 10 20 30 40 50 60 57 x y 60 60 50+ 50- 40- 40+ 30-...
Can you please answers these four questions as aoin as
possible please and thank you!
Given are five observations for two variables, z and y 5 13 20 18 48 57 11 27 a. Choose the corre rect scatter diagram for these data: A. B. 60+ 60 50 50 40 40 30+ 30 20 20 10 10- 10 20 30 40 50 60 x 10 20 30 40 50 60 57 x y 60 60 50+ 50- 40- 40+ 30-...
 Young Brands OUNG BRANDS (YB) is a manufacturer of sports clothing and team uniforms. Its industry is quite competitive, so the management team has attempted to operate a modern operation with state-of-the-art production facilities. Careful cost management has been an important factor in attaining profits. YB is considered a leader for its fashion sense, pricing, market- ing, and product quality. Professional and university-team uniforms and affiliated products are sold by company salesmen to teams and to retail stores throughout North...
 2) For Nescafe Taster's Choice, what is the projected variable
cost of coffee
beans for a 100-cup jar if you decide to use the FLO Fairtrade mark
for
Farmers Blend?
$5.82
$4.66
$2.91
$2.33
$2.00
Your team has gathered the following information to assist with your decision. Farmers Blend would launch in 100-cup jars (standard size) O Regardless of branding choices, S5 million for advertising and promotions should produce 40% awareness among instant coffee drinkers and 60% ACV distribution I...
2) For Nescafe Taster's Choice, what is the projected variable
cost of coffee
beans for a 100-cup jar if you decide to use the FLO Fairtrade mark
for
Farmers Blend?
$5.82
$4.66
$2.91
$2.33
$2.00
Your team has gathered the following information to assist with your decision. Farmers Blend would launch in 100-cup jars (standard size) O Regardless of branding choices, S5 million for advertising and promotions should produce 40% awareness among instant coffee drinkers and 60% ACV distribution I...
Most questions answered within 3 hours.
-
Where is the error in this code sequence?
String s1 = "Hello";
String s2 = "ello";...
asked 11 months ago -
Financial data for Joel de Paris, Inc., for last year
follow:
Joel de Paris, Inc.
Balance...
asked 11 months ago -
Consider this reaction:
Al2(SO4)3 (aq)+ BaCl3
(aq) Al2Cl6 (aq)- +
3BaSO4(s) . What is the...
asked 11 months ago -
Suppose that Savneet is considering increasing her
recent random sample from 20 car rentals to 40...
asked 11 months ago -
Trucks arrive at an unloading terminal at an average rate of 120
per hour.
Trucks arrive...
asked 11 months ago -
Why are methanol and ethanol completely soluble in water while
octanol is not very little soluble....
asked 11 months ago -
A facilities manager at a university reads in a research report
that the mean amount of...
asked 11 months ago -
When the CuSO4 is rehydrated by adding water to the anhydrous
compound, is this an endothermic...
asked 11 months ago -
A ray of sunlight is passing from diamond into crown glass; the
angle of incidence is...
asked 11 months ago -
A block of mass 0.249 kg is placed on top of a light, vertical
spring of...
asked 11 months ago -
how do the kidneys compensate in the presences of acidosis
a) trigger hyperventilate
b) reserve acid...
asked 11 months ago -
Question 501 pts
The rental rate of capital to the firm increases. Which of the
following...
asked 11 months ago