To complete this problem you must have a computer that is capable of viewing Scalable Vect...
To complete this problem you must have a computer that is capable of viewing Scalable Vector Graphics (SVG) files. Your Web browser may al- solution to Programming ready be able to view these files. To test to see if your browser can display SVG files, type in the rectline.svg file below and see if you can open it in your Web browser. If your Web browser cannot view the file, then you can search on the Web and download a free SVG viewer.
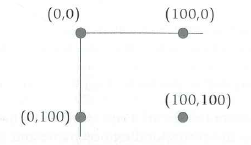
The graphics screen to draw an image uses a coordinate system in which (0, 0) is located in the upper-left corner. The x co-ordinate increases to the right, and they coordinate increases to the bottom. Consequently, coordinate (100, 0) would be located 100 pixels directly toward the right from the upper-left corner, and coordinate (0, 100) would be located 100 pixels directly toward the bottom from the upper-left corner. This is illustrated in the figure below.
The SVG format defines a graphics image using XML. The specification for die image is stored in a text file and can be displayed by an SVG viewer. Here is a sample SVG file that draws two rectangles and a line. To view it, save it to a text file with the “.svg” extension, such as rectline. svg, and open it with your SVG viewer.
“http://www.w3.org/Graphi cs/SVG/1.1/DTD/svgll.dtd”>
xmlns=“http://www.w3.org/2000/svg”>
style=“fi11:blue;”/>
style=“fill:rgb(0,255,0);”/> <1ine xl=“0” yl=“0” x2=“300”
y2=“300” style=“stroke:purple;stroke-width:2”/>
For purposes of this problem, you can ignore the first five lines and the last line and consider them “boilerplate” that must be inserted to properly create the image.
The lines that begins with erect x=“20”... draw a blue rectangle whose upper-left corner is at coordinate (20, 20) and whose width is 50 pixels and height is 250 pixels.
The lines that begin with
Finally, the
Based on this example, write a program that inputs four nonnegative integer values and creates the SVG file that displays a simple bar chart that depicts the integer values. Your program should scale the values so they are always drawn with a maximum height of 400 pixels. For example, if your input values to graph were 20, 40, 60, and 120, you might generate a SVG file that would display as follows:

Step-by-Step Solution
Request Solution!
We need at least 10 more requests to produce the solution.
0 / 10 have requested this problem solution
The more requests, the faster the answer.
Most questions answered within 3 hours.
-
Calculating the space time for parallel reactions. m-Xylene is reacted over a ZSM-5 zeolit...
-
Determine Vo and ID for the networks of Fig. 2.160.FIG. 2.160
-
The truck travels along a circular road that has a radius of 50 m at a speed of 4 m/s. F...
-
A state legislature enacted a statute that required any motorcycle operator or passenger...
-
A 1024 × 1024 8-bit image with 5.3 bits/pixel entropy [computed from its histogram using E...
-
In Problem 3.3, we estimated the equationwhere we now report standard errors along with th...
-
In each of the following cases, deduce the nature of the light that is consistent with the...
-
Solve Example 20.5 such that the x, y, z axes move with curvilinear translation, Ω = 0 in...
-
In Fig. 6.43, if i = cos 4t and v = sin 4t, the element is:(a)a resistor(b) a capacitor(c)...
-
Sketch vo for each network of Fig. 2.181 for the input shown.FIG. 2.181
-
(Supplement B) Computing and Reporting Cash Flow Effectsof Sale of Plant and EquipmentDuri...
-
A 350-mL spherical flask contains 0.075 mol of an ideal gas at a temperature of 293 K. Wha...