Execute batch4.m of Example to regenerate the data sets and the plot shown in Figure. Now...
Execute batch4.m of Example to regenerate the data sets and the plot shown in Figure. Now plot log10(rk4_vect) versus log10(h_vect) with the command plot(log10(h_vect),log10(rk4_vect),'ro'). The points produced by this plot command should appear to maintain a linear relationship. Use the following code to determine and plot the “line of best fit” through the these data points (type help polyfit and help polyval to get a full explanation of these commands).

Write the equation of the line of best fit in the form log10(rk4_vect) = C log10(h_vect) + B, where C and B are the slope and intercept captured from the polyfit command. Solve this last equation for rk4_vect. How closely does this last equation compare with the inequality (5.7)?
a) Perform a similar analysis on eul_vect and h_vect and compare with the inequality (5.5).
b) Perform a similar analysis on rk2_vect and h_vect and compare with the inequality (5.6).
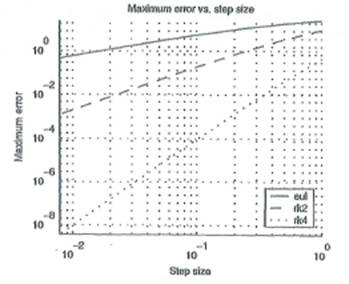
Figure Error comparison for Euler RK2, and RK4
Step-by-Step Solution
Request Solution!
We need at least 10 more requests to produce the solution.
0 / 10 have requested this problem solution
The more requests, the faster the answer.
Most questions answered within 3 hours.
-
Calculating the space time for parallel reactions. m-Xylene is reacted over a ZSM-5 zeolit...
-
Determine Vo and ID for the networks of Fig. 2.160.FIG. 2.160
-
The truck travels along a circular road that has a radius of 50 m at a speed of 4 m/s. F...
-
A state legislature enacted a statute that required any motorcycle operator or passenger...
-
A 1024 × 1024 8-bit image with 5.3 bits/pixel entropy [computed from its histogram using E...
-
In Problem 3.3, we estimated the equationwhere we now report standard errors along with th...
-
In each of the following cases, deduce the nature of the light that is consistent with the...
-
Solve Example 20.5 such that the x, y, z axes move with curvilinear translation, Ω = 0 in...
-
In Fig. 6.43, if i = cos 4t and v = sin 4t, the element is:(a)a resistor(b) a capacitor(c)...
-
Sketch vo for each network of Fig. 2.181 for the input shown.FIG. 2.181
-
(Supplement B) Computing and Reporting Cash Flow Effectsof Sale of Plant and EquipmentDuri...
-
A 350-mL spherical flask contains 0.075 mol of an ideal gas at a temperature of 293 K. Wha...