Approximate the measures of center for following GFDT. Data Frequency 50 - 54 2 55 -...
Homework Answers
Solution
First we need to make class intervals continous so we subtract 0.5 from lower limit and add 0.5 in upper bound so we get the following table
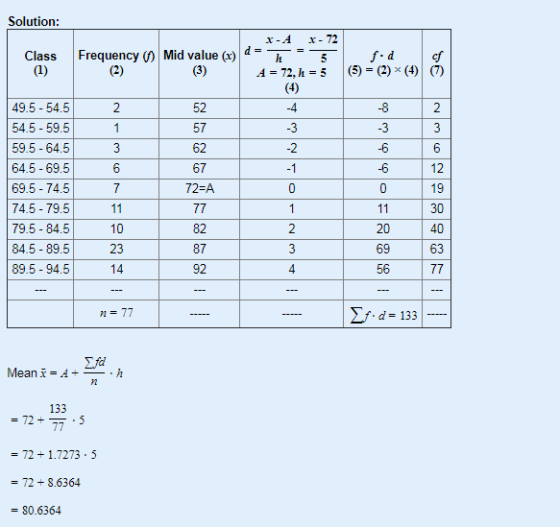
mean = 80.6

Median = 83.8
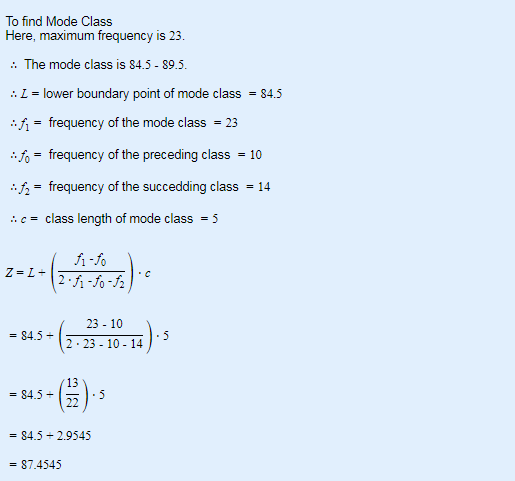
Mode = 87.4
Add Answer to:
Approximate the measures of center for following GFDT.
Data Frequency
50 - 54 2
55 -...
Approximate the measures of center for following GFDT.
Approximate the measures of center for following GFDT.DataFrequency50 - 541055 - 592360 - 641365 - 691270 - 74575 - 79780 - 84485 - 89090 - 941mode = median = mean = Report mode and median accurate to one decimal place. Report the mean accurate to two decimal places (or enter as a fraction).
Approximate the measures of center for following GFDT.
Approximate the measures of center for following GFDT.DataFrequency60 - 64165 - 69070 - 74475 - 79380 - 84685 - 891090 - 941195 - 9919100 - 10411mode = median = mean = Report mode and median accurate to one decimal place. Report the mean accurate to two decimal places (or enter as a fraction).
Approximate the measures of center for following GFDT.
Approximate the measures of center for following GFDT.DataFrequency40 - 44245 - 49250 - 54755 - 591560 - 641965 - 691170 - 74775 - 79080 - 846mode = median = mean = Report mode and median accurate to one decimal place. Report the mean accurate to two decimal places (or enter as a fraction).
Approximate the measures of center for following GFDT. Data Frequency 40 - 44 2 45 -...
Approximate the measures of center for following GFDT. Data Frequency 40 - 44 2 45 - 49 3 50 - 54 4 55 - 59 11 60 - 64 22 65 - 69 14 70 - 74 8 75 - 79 1 80 - 84 4 mode = median = mean =
Approximate the measures of center for following GFDT. Frequency ons (0.4/2) 2 [0.6/2] 312/21 412/21 [2/2]...
 Approximate the measures of center for following GFDT. Frequency ons (0.4/2) 2 [0.6/2] 312/21 412/21 [2/2] R60121 BZ (0/2) Q B.(0/2) de: 8/16 Data 40-44 45-49 50-54 55- 60 65 - 70-74 at Version 75-79 80-84 mode mediana Preview mean = Report mode and median accurate to one decimal place. Report the mean accurat Points possible: 2 This is attempt of Submit
Approximate the measures of center for following GFDT. Data Frequency 30 - 34 2 35 -...
Approximate the measures of center for following GFDT. Data Frequency 30 - 34 2 35 - 39 0 40 - 44 12 45 - 49 16 50 - 54 11 Report mode and median accurate to one decimal place. Report the mean accurate to two decimal places (or enter as a fraction). (a) mode = (b) median = (c) mean =
ttps:/lysu.blackboard.com/ultra/courses/42107 1/cl/outline OM HW & Quizzes My Open Math Assignments G 2019 > Assessment : Measures...
 ttps:/lysu.blackboard.com/ultra/courses/42107 1/cl/outline OM HW & Quizzes My Open Math Assignments G 2019 > Assessment : Measures of Center and Spread Due in 13 hours, 35 minute Find the measures of center for following Data Frequency 40-44 45 -49 50 54 55-5911 60-64 65 69 70-74 75 -79 12 sion 80-84 6 mode- median mean (round to 4 decimal places) Hiwr Textbook Measures of Center
Consider the below matrixA, which you can copy and paste directly into Matlab.
Problem #1: Consider the below matrix A, which you can copy and paste directly into Matlab. The matrix contains 3 columns. The first column consists of Test #1 marks, the second column is Test # 2 marks, and the third column is final exam marks for a large linear algebra course. Each row represents a particular student.A = [36 45 75 81 59 73 77 73 73 65 72 78 65 55 83 73 57 78 84 31 60 83...
The following scores represent the final examination grades for an elementary statistics course:
The following scores represent the final examination grades for an elementary statistics course: 23 60 79 32 57 74 52 70 82 36 80 77 81 95 41 65 92 85 55 76 52 10 64 75 78 25 80 98 81 67 41 71 83 54 64 72 88 62 74 43 60 78 89 76 84 48 84 90 15 79 34 67 17 82 69 74 63 80 85 61 Calculate: Stem and leaf Relative frequency histogram Cumulative frequency Sample Mean Sample Median Mode Variance Standard deviation
02 The following scores represent the final examination grades for an elementary statistics course: 23 60...
 02 The following scores represent the final examination grades for an elementary statistics course: 23 60 79 32 57 74 52 70 82 36 80 77 81 95 41 65 92 85 55 76 52 10 64 75 78 25 80 98 81 67 41 71 83 54 64 72 88 62 74 43 60 78 89 76 84 48 84 90 15 79 34 67 17 82 69 74 63 80 85 61 Calculate: . Stem and leaf ....
 Approximate the measures of center for following GFDT. Frequency ons (0.4/2) 2 [0.6/2] 312/21 412/21 [2/2] R60121 BZ (0/2) Q B.(0/2) de: 8/16 Data 40-44 45-49 50-54 55- 60 65 - 70-74 at Version 75-79 80-84 mode mediana Preview mean = Report mode and median accurate to one decimal place. Report the mean accurat Points possible: 2 This is attempt of Submit
 ttps:/lysu.blackboard.com/ultra/courses/42107 1/cl/outline OM HW & Quizzes My Open Math Assignments G 2019 > Assessment : Measures of Center and Spread Due in 13 hours, 35 minute Find the measures of center for following Data Frequency 40-44 45 -49 50 54 55-5911 60-64 65 69 70-74 75 -79 12 sion 80-84 6 mode- median mean (round to 4 decimal places) Hiwr Textbook Measures of Center
 02 The following scores represent the final examination grades for an elementary statistics course: 23 60 79 32 57 74 52 70 82 36 80 77 81 95 41 65 92 85 55 76 52 10 64 75 78 25 80 98 81 67 41 71 83 54 64 72 88 62 74 43 60 78 89 76 84 48 84 90 15 79 34 67 17 82 69 74 63 80 85 61 Calculate: . Stem and leaf ....
Most questions answered within 3 hours.
-
Where is the error in this code sequence?
String s1 = "Hello";
String s2 = "ello";...
asked 11 months ago -
Financial data for Joel de Paris, Inc., for last year
follow:
Joel de Paris, Inc.
Balance...
asked 11 months ago -
Consider this reaction:
Al2(SO4)3 (aq)+ BaCl3
(aq) Al2Cl6 (aq)- +
3BaSO4(s) . What is the...
asked 11 months ago -
Suppose that Savneet is considering increasing her
recent random sample from 20 car rentals to 40...
asked 11 months ago -
Trucks arrive at an unloading terminal at an average rate of 120
per hour.
Trucks arrive...
asked 11 months ago -
Why are methanol and ethanol completely soluble in water while
octanol is not very little soluble....
asked 11 months ago -
A facilities manager at a university reads in a research report
that the mean amount of...
asked 11 months ago -
When the CuSO4 is rehydrated by adding water to the anhydrous
compound, is this an endothermic...
asked 11 months ago -
A ray of sunlight is passing from diamond into crown glass; the
angle of incidence is...
asked 11 months ago -
A block of mass 0.249 kg is placed on top of a light, vertical
spring of...
asked 11 months ago -
how do the kidneys compensate in the presences of acidosis
a) trigger hyperventilate
b) reserve acid...
asked 11 months ago -
Question 501 pts
The rental rate of capital to the firm increases. Which of the
following...
asked 11 months ago