5. Consider total cost and total revenue given in the following table:
5. Consider total cost and total revenue given in the following table:

a. Calculate profit for each quantity. How much should the firm produce to maximize profit?
b. Calculate marginal revenue and marginal cost for each quantity. Graph them. (Hint: Put the points between whole numbers. For example, the marginal cost between 2 and 3 should be graphed at 2/½.)
c. At what quantity do the curves in part b cross? How does this relate to your answer to part a.?
d. Can you tell whether this firm is in a competitive industry?
e. Is the industry in long-run equilibrium?
Homework Answers
| Q | TC | TR | MC | MR | PROFIT |
| 0 | 24 | 0 | -24 | ||
| 0.5 | 3 | 24 | |||
| 1 | 27 | 24 | -3 | ||
| 1.5 | 3 | 24 | |||
| 2 | 30 | 48 | 18 | ||
| 2.5 | 3 | 24 | |||
| 3 | 33 | 72 | 39 | ||
| 3.5 | 6 | 24 | |||
| 4 | 39 | 96 | 57 | ||
| 4.5 | 21 | 24 | |||
| 5 | 60 | 120 | 60 | ||
| 5.5 | 27 | 24 | |||
| 6 | 87 | 144 | 57 | ||
| 6.5 | 32 | 24 | |||
| 7 | 119 | 168 | 49 |
a) Profit = TR-TC
The firm will set MC=MR for profit maximization and should produce 5 units to maximize profits
b) MR = change in TR/change in Q
MC = change in TC/change in Q
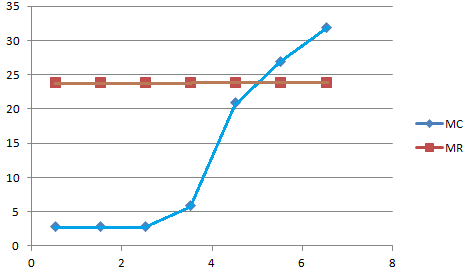
c) They intersect each other at Q=5 units as found out in part a
d) This firm is in a competitive industry as the MR is constant
e) No, because in the long run the profits are zero whereas this industry is having positive economic profits.
Add Answer to:
5. Consider total cost and total revenue given in the following table:
Consider total cost and total revenue given in the table below:
. Consider total cost and total revenue given in the table below:QUANTITY 0 1 2 3 4 5 6 7Total cost $8 $9 $10 $11 $13 $19 $27 $37Total revenue 0 8 16 24 32 40 48 56a. Calculate profit for each quantity. How much should the firm produce to maximize profit?b. Calculate marginal revenue and marginal cost for each quantity. Graph them. (Hint: Put the points between whole numbers. For example, the marginal cost between 2 and 3 should...
Consider total cost and total revenue, given in the following table: In the final column, enter...
 Consider total cost and total revenue, given in the following
table:
In the final column, enter profit for each quantity.
(Note: If the firm suffers a loss, enter a
negative number in the appropriate cell.)
Quantity
Total Cost
Marginal Cost
Total Revenue
Marginal Revenue
Profit
(Dollars)
(Dollars)
(Dollars)
(Dollars)
(Dollars)
0
6
0
1
8
7
2
10
14
3
13
21
4
17
28
5
24
35
6
32
42
7
42
49
In order to maximize profit, how...
Consider total cost and total revenue, given in the following
table:
In the final column, enter profit for each quantity.
(Note: If the firm suffers a loss, enter a
negative number in the appropriate cell.)
Quantity
Total Cost
Marginal Cost
Total Revenue
Marginal Revenue
Profit
(Dollars)
(Dollars)
(Dollars)
(Dollars)
(Dollars)
0
6
0
1
8
7
2
10
14
3
13
21
4
17
28
5
24
35
6
32
42
7
42
49
In order to maximize profit, how...
3. Problems and Applications Q3 Consider total cost and total revenue, given in the following table:...
 3. Problems and Applications Q3
Consider total cost and total revenue, given in the following
table:
We were unable to transcribe this image10 T Marginal Revenue Marginal Cost Quantity of 6 units The marginal-revenue curve and the marginal-cost curve cross at a quantity , as quantity increases. in a competitive industry, because marginal revenue is This firm is not True or False: The industry is in a long-run equilibrium True O False
3. Problems and Applications Q3
Consider total cost and total revenue, given in the following
table:
We were unable to transcribe this image10 T Marginal Revenue Marginal Cost Quantity of 6 units The marginal-revenue curve and the marginal-cost curve cross at a quantity , as quantity increases. in a competitive industry, because marginal revenue is This firm is not True or False: The industry is in a long-run equilibrium True O False
b) (4 points) Graph demand, marginal revenue, marginal cost and average total cost (ATC) below. Mark...
 b) (4 points) Graph demand, marginal revenue, marginal cost and
average total cost (ATC) below. Mark Q*, P*, ATC* (you’ll have to
calculate it) and the endpoints to all of the curves.
c) (2 points) Given your answers above, explain which curve(s)
will shift in the long run and why.
d) (4 points) Draw the graph that represents this firm in the
long-run. Label the profit-maximizing price and quantity as P* and
Q*, respectively. No numbers are necessary, but be...
b) (4 points) Graph demand, marginal revenue, marginal cost and
average total cost (ATC) below. Mark Q*, P*, ATC* (you’ll have to
calculate it) and the endpoints to all of the curves.
c) (2 points) Given your answers above, explain which curve(s)
will shift in the long run and why.
d) (4 points) Draw the graph that represents this firm in the
long-run. Label the profit-maximizing price and quantity as P* and
Q*, respectively. No numbers are necessary, but be...
Consider total cost and total revenue given in the following: (Quantity/Total Cost/Total Revenue): (0/8/0), (1/9/8), (2/10/16), (3/11/24), (4/13/32), (5/19/40), (6/27/48), (7/37/56) Can you tell whether this firm is in a competitive industry
Consider total cost and total revenue given in the following: (Quantity/Total Cost/Total Revenue): (0/8/0), (1/9/8), (2/10/16), (3/11/24), (4/13/32), (5/19/40), (6/27/48), (7/37/56) Can you tell whether this firm is in a competitive industry? If so, can you tell whether the industry is in a long-run equilibrium? Isn't this firm a competitive industry since the price is equal to the marginal revenue? This is obviously a competitive industry because the average revenue is always the same. But the euqilibrium is not the...
k. The following table shows the revenue and cost information for a firm in a competitive...
 k. The following table shows the revenue and cost information for a firm in a competitive market. a) Fill in the missing information. $Price $Total Revenue Marginal Revenue SMC 80 Quantity 0 5 10 15 20 25 30 $Total Cost 100 600 1,075 1,525 1,925 2,525 3,525 b) Based on this information, what are the firm's fixed costs? How do you know? c) What quantity is the firm's profit maximizing quantity? Explain. d) Graph the total revenue and the total...
9. Problems and Applications Q4 Consider total cost and total revenue, given in the following table:...
9. Problems and Applications Q4 Consider total cost and total revenue, given in the following table: In the final column, enter profit for each quantity. (Note: If the firm suffers a loss, enter a negative number in the appropriate cell.) Quantity Total Cost Marginal Cost Total Revenue Marginal Revenue Profit (Dollars) (Dollars) (Dollars) (Dollars) (Dollars) 0 8 0 1 9 8 2 10 16 3 11 24 4 13 32 5 19 40 6 27 48 7 37 56 In...
2. The following table shows the revenue and cost information for a firm in a competitive...
 2. The following table shows the revenue and cost information for a firm in a competitive market. $Price $Total Revenue $Marginal Revenue SMC Quantity 0 5 400 80 80 80 10 15 800 80 80 80 $Total Cost 100 600 1,075 1,525 1,925 2,525 3,525 1200 1600 100 95 90 80 120 200 80 80 20 25 30 80 80 2000 2400 80 80 a) Graph the total revenue and the total cost curves on a graph. Show that profit...
In the final column, enter profit for each quantity. (Note: If the firm suffers a loss, enter a negative number in the appropriate cell.)
 In the final column, enter profit for each quantity. (Note: If the firm suffers a loss, enter a negative number in the appropriate cell.) In order to maximize profit, how many units should the firm produce? Check all that apply.4567In the previous table, enter marginal revenue and marginal cost for each quantity.On the following graph, use the green points (triangle symbol) to graph the marginal-revenue curve, then use the orange points (square symbol) to plot the marginal-cost curve. (Note: Be sure...
Total Revenue Marginal Revenue 1) For the following firm in a competitive market, COSTS REVENUES Quantity...
 Total Revenue Marginal Revenue 1) For the following firm in a competitive market, COSTS REVENUES Quantity Total Marginal Quantity Produced Cost Cost Demanded Price SO $80 $50 $80 $102 $80 $157 $80 $217 SSO $285 $80 $365 $80 $462 $80 8 $582 IS $80 a) Fill the column for marginal cost, total revenue and marginal revenue. b) What is interesting about the numbers you find for marginal revenue. c) Based on profit maximization rule that you learned in Chapter 14...
 Consider total cost and total revenue, given in the following
table:
In the final column, enter profit for each quantity.
(Note: If the firm suffers a loss, enter a
negative number in the appropriate cell.)
Quantity
Total Cost
Marginal Cost
Total Revenue
Marginal Revenue
Profit
(Dollars)
(Dollars)
(Dollars)
(Dollars)
(Dollars)
0
6
0
1
8
7
2
10
14
3
13
21
4
17
28
5
24
35
6
32
42
7
42
49
In order to maximize profit, how...
Consider total cost and total revenue, given in the following
table:
In the final column, enter profit for each quantity.
(Note: If the firm suffers a loss, enter a
negative number in the appropriate cell.)
Quantity
Total Cost
Marginal Cost
Total Revenue
Marginal Revenue
Profit
(Dollars)
(Dollars)
(Dollars)
(Dollars)
(Dollars)
0
6
0
1
8
7
2
10
14
3
13
21
4
17
28
5
24
35
6
32
42
7
42
49
In order to maximize profit, how...
 3. Problems and Applications Q3
Consider total cost and total revenue, given in the following
table:
We were unable to transcribe this image10 T Marginal Revenue Marginal Cost Quantity of 6 units The marginal-revenue curve and the marginal-cost curve cross at a quantity , as quantity increases. in a competitive industry, because marginal revenue is This firm is not True or False: The industry is in a long-run equilibrium True O False
3. Problems and Applications Q3
Consider total cost and total revenue, given in the following
table:
We were unable to transcribe this image10 T Marginal Revenue Marginal Cost Quantity of 6 units The marginal-revenue curve and the marginal-cost curve cross at a quantity , as quantity increases. in a competitive industry, because marginal revenue is This firm is not True or False: The industry is in a long-run equilibrium True O False
 b) (4 points) Graph demand, marginal revenue, marginal cost and
average total cost (ATC) below. Mark Q*, P*, ATC* (you’ll have to
calculate it) and the endpoints to all of the curves.
c) (2 points) Given your answers above, explain which curve(s)
will shift in the long run and why.
d) (4 points) Draw the graph that represents this firm in the
long-run. Label the profit-maximizing price and quantity as P* and
Q*, respectively. No numbers are necessary, but be...
b) (4 points) Graph demand, marginal revenue, marginal cost and
average total cost (ATC) below. Mark Q*, P*, ATC* (you’ll have to
calculate it) and the endpoints to all of the curves.
c) (2 points) Given your answers above, explain which curve(s)
will shift in the long run and why.
d) (4 points) Draw the graph that represents this firm in the
long-run. Label the profit-maximizing price and quantity as P* and
Q*, respectively. No numbers are necessary, but be...
 k. The following table shows the revenue and cost information for a firm in a competitive market. a) Fill in the missing information. $Price $Total Revenue Marginal Revenue SMC 80 Quantity 0 5 10 15 20 25 30 $Total Cost 100 600 1,075 1,525 1,925 2,525 3,525 b) Based on this information, what are the firm's fixed costs? How do you know? c) What quantity is the firm's profit maximizing quantity? Explain. d) Graph the total revenue and the total...
 2. The following table shows the revenue and cost information for a firm in a competitive market. $Price $Total Revenue $Marginal Revenue SMC Quantity 0 5 400 80 80 80 10 15 800 80 80 80 $Total Cost 100 600 1,075 1,525 1,925 2,525 3,525 1200 1600 100 95 90 80 120 200 80 80 20 25 30 80 80 2000 2400 80 80 a) Graph the total revenue and the total cost curves on a graph. Show that profit...
 Total Revenue Marginal Revenue 1) For the following firm in a competitive market, COSTS REVENUES Quantity Total Marginal Quantity Produced Cost Cost Demanded Price SO $80 $50 $80 $102 $80 $157 $80 $217 SSO $285 $80 $365 $80 $462 $80 8 $582 IS $80 a) Fill the column for marginal cost, total revenue and marginal revenue. b) What is interesting about the numbers you find for marginal revenue. c) Based on profit maximization rule that you learned in Chapter 14...
Most questions answered within 3 hours.
-
Where is the error in this code sequence?
String s1 = "Hello";
String s2 = "ello";...
asked 11 months ago -
Financial data for Joel de Paris, Inc., for last year
follow:
Joel de Paris, Inc.
Balance...
asked 11 months ago -
Consider this reaction:
Al2(SO4)3 (aq)+ BaCl3
(aq) Al2Cl6 (aq)- +
3BaSO4(s) . What is the...
asked 11 months ago -
Suppose that Savneet is considering increasing her
recent random sample from 20 car rentals to 40...
asked 11 months ago -
Trucks arrive at an unloading terminal at an average rate of 120
per hour.
Trucks arrive...
asked 11 months ago -
Why are methanol and ethanol completely soluble in water while
octanol is not very little soluble....
asked 11 months ago -
A facilities manager at a university reads in a research report
that the mean amount of...
asked 11 months ago -
When the CuSO4 is rehydrated by adding water to the anhydrous
compound, is this an endothermic...
asked 11 months ago -
A ray of sunlight is passing from diamond into crown glass; the
angle of incidence is...
asked 11 months ago -
A block of mass 0.249 kg is placed on top of a light, vertical
spring of...
asked 11 months ago -
how do the kidneys compensate in the presences of acidosis
a) trigger hyperventilate
b) reserve acid...
asked 11 months ago -
Question 501 pts
The rental rate of capital to the firm increases. Which of the
following...
asked 11 months ago