This is stat question and the data show as below

![Flows in the Credit River in Mississauga are given in the file credit.MP] or in the file credit.xlsx.](http://img.homeworklib.com/questions/d5a4d8f0-6e2f-11ea-a7fb-8f026910b17b.png?x-oss-process=image/resize,w_560)


Homework Answers
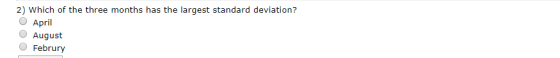
2. The April month have largest standard deviation value. And it is equal to =87.03
3. After viewing boxplot for August month, it seems it doesn’t contain outlier.
Add Answer to:
This is stat question and the data show as below
This is stat question and the...
This is stat question and the data show as below This is stat question and the...
 This is stat question and the data show as below This is stat question and the data show as below Flows in the Credit River in Mississauga are given in the file 'credit.MPJ' or in the file 'credit.xlsx'. C1 C2 Feb C3 C4 C5 April Lu 36 260 95 72 327 184 154 58 178 205 335 101 62 294 250 92 87 64 87 224 69 129 95 238 127 163 239 124 17 18 19 20 21 61...
Problem 1 The table below presents data for tire sales in the Costco Branch at South...
 Problem 1 The table below presents data for tire sales in the Costco Branch at South Dakota Avenue, Washington D.C. from the months of January through December of the Year 2019. 5983 Automobile Month Year Tire Sales January 5610 2019 February 5790 2019 March 2019 2019 April 6202 6460 2019 May 6608 2019 June July 2019 August 2019 9110 September 2019 8690 October 2019 8799 November 2019 8896 December 2019 9210 a. Compute a two-month moving average. What is the...
The boxplots below show the distribution of test scores for two classes. Class A Class B...
 The boxplots below show the distribution of test scores for two classes. Class A Class B 0 80 90 100 10 20 30 40 50 60 70 Test scores Which of the following statements is a valid conclusion that can be drawn from the boxplots? Choose all that apply. At least 25% of each class earned a B (80 or higher on the exam). Class B has more students than class A. Class A and B have approximately the same...
QUESTION- Before applying any inferential tools to the data, always conduct a preliminary analysi...
 QUESTION- Before applying any inferential tools to the data,
always conduct a preliminary analysis to get an idea about the
association between your variables. In addition, the results of a
statistical analysis are valid only if the appropriate assumptions
for the model to be used are valid. The assumptions for the ANOVA
are that the data are independent and come from normal populations
with equal variances (or standard deviations). In particular:
(a) Obtain the summary statistics (sample size, mean, standard...
QUESTION- Before applying any inferential tools to the data,
always conduct a preliminary analysis to get an idea about the
association between your variables. In addition, the results of a
statistical analysis are valid only if the appropriate assumptions
for the model to be used are valid. The assumptions for the ANOVA
are that the data are independent and come from normal populations
with equal variances (or standard deviations). In particular:
(a) Obtain the summary statistics (sample size, mean, standard...
Please answer all of the following. The boxplot below shows the number of contacts in their...
 Please answer all of the following.
The boxplot below shows the number of contacts in their cell by gender for my Spring 2018 statistics classes. Using the boxplot, answer the 4 questions below. Boxplot of CellNumbers 900 800 700 600 500 400 300 200 100 0 Male Female Gender CellNumbers Which distribution has 3 outliers? Which distribution appears skewed right, excluding 1. Male 1 outliers? 2. Female Which distribution is 1 3. Both less variable (has the smaller IQR)? 4....
Please answer all of the following.
The boxplot below shows the number of contacts in their cell by gender for my Spring 2018 statistics classes. Using the boxplot, answer the 4 questions below. Boxplot of CellNumbers 900 800 700 600 500 400 300 200 100 0 Male Female Gender CellNumbers Which distribution has 3 outliers? Which distribution appears skewed right, excluding 1. Male 1 outliers? 2. Female Which distribution is 1 3. Both less variable (has the smaller IQR)? 4....
Problem 1 The table below presents data for tire sales in the Costco Branch at South Dakota Avenue, Washington D.C. from the months of July through December of the Year 2017. Automobile Tire Sales 55...
 Problem 1 The table below presents data for tire sales in the Costco Branch at South Dakota Avenue, Washington D.C. from the months of July through December of the Year 2017. Automobile Tire Sales 550 576 590 602 622 664 689 905 860 869 886 920 Y ear 2018 2018 2018 2018 2018 2018 2018 2018 2018 2018 2018 2018 Month Janua Februar March April June Jul August September October November December a. Compute a two-month moving average. What is...
HELP needed urgently....Data and question is attacted below..... Thank you in advance there is no data...
 HELP needed urgently....Data and question is attacted below.....
Thank you in advance
there is no data link fir this data it’s all in photos.... thank
you
i
have already posted the question
We were unable to transcribe this imageNo. 2 3 4 5 6 7 8 Working Sector Public Own Public Public Private Public Private Private Own Own Private Public Public Public Private 9 10 11 12 13 Public IS 16 17 18 19 20 21 22 23 24 25...
HELP needed urgently....Data and question is attacted below.....
Thank you in advance
there is no data link fir this data it’s all in photos.... thank
you
i
have already posted the question
We were unable to transcribe this imageNo. 2 3 4 5 6 7 8 Working Sector Public Own Public Public Private Public Private Private Own Own Private Public Public Public Private 9 10 11 12 13 Public IS 16 17 18 19 20 21 22 23 24 25...
Answer in order please thank you. Question1 A survey was conducted from a random sample of...
 Answer in order please thank you.
Question1 A survey was conducted from a random sample of 8225 Americans, and one Selecd variable that was recorded for each participant was their answer to the question, "How old are you?" 1o points The mean of this data was found to be 42, while the median was 37. What does this tell you about the shape of this distribution? A. O It is symmetric. B. O It is skewed left. C. There is...
Answer in order please thank you.
Question1 A survey was conducted from a random sample of 8225 Americans, and one Selecd variable that was recorded for each participant was their answer to the question, "How old are you?" 1o points The mean of this data was found to be 42, while the median was 37. What does this tell you about the shape of this distribution? A. O It is symmetric. B. O It is skewed left. C. There is...
Stat 255 Project 3 due Wednesday, April 22 Write R code to solve the following problems, Make sur...
 I am just wanting the first question answered.
Stat 255 Project 3 due Wednesday, April 22 Write R code to solve the following problems, Make sure to include descriptions and explanation in your cod Save them in a file named project3-yourname.R and email them to ysarolousi.edu be date. A model for stock prices Let S, be the closing price of a stock at the end of day j, where j model for the evolution of the future daily closing prices:...
I am just wanting the first question answered.
Stat 255 Project 3 due Wednesday, April 22 Write R code to solve the following problems, Make sure to include descriptions and explanation in your cod Save them in a file named project3-yourname.R and email them to ysarolousi.edu be date. A model for stock prices Let S, be the closing price of a stock at the end of day j, where j model for the evolution of the future daily closing prices:...
QUESTION 27 Q27. A manager at a local bank analyzed the relationship between monthly salary (y,...
 QUESTION 27 Q27. A manager at a local bank analyzed the relationship between monthly salary (y, in $) and length of service (x, measured in months) for 30 employees. She estimates the model: Salary = Bo + B1 Service + ε. The following ANOVA table below shows a portion of the regression results. df SS M S F Regression 555,420 555,420 7.64 Residual 27 1,962,873 72,699 Total 28 2 ,518,293 Coefficients Standard Error t-stat p-value Intercept 784.92 322.25 2.44 0.02...
 This is stat question and the data show as below This is stat question and the data show as below Flows in the Credit River in Mississauga are given in the file 'credit.MPJ' or in the file 'credit.xlsx'. C1 C2 Feb C3 C4 C5 April Lu 36 260 95 72 327 184 154 58 178 205 335 101 62 294 250 92 87 64 87 224 69 129 95 238 127 163 239 124 17 18 19 20 21 61...
 Problem 1 The table below presents data for tire sales in the Costco Branch at South Dakota Avenue, Washington D.C. from the months of January through December of the Year 2019. 5983 Automobile Month Year Tire Sales January 5610 2019 February 5790 2019 March 2019 2019 April 6202 6460 2019 May 6608 2019 June July 2019 August 2019 9110 September 2019 8690 October 2019 8799 November 2019 8896 December 2019 9210 a. Compute a two-month moving average. What is the...
 The boxplots below show the distribution of test scores for two classes. Class A Class B 0 80 90 100 10 20 30 40 50 60 70 Test scores Which of the following statements is a valid conclusion that can be drawn from the boxplots? Choose all that apply. At least 25% of each class earned a B (80 or higher on the exam). Class B has more students than class A. Class A and B have approximately the same...
 QUESTION- Before applying any inferential tools to the data,
always conduct a preliminary analysis to get an idea about the
association between your variables. In addition, the results of a
statistical analysis are valid only if the appropriate assumptions
for the model to be used are valid. The assumptions for the ANOVA
are that the data are independent and come from normal populations
with equal variances (or standard deviations). In particular:
(a) Obtain the summary statistics (sample size, mean, standard...
QUESTION- Before applying any inferential tools to the data,
always conduct a preliminary analysis to get an idea about the
association between your variables. In addition, the results of a
statistical analysis are valid only if the appropriate assumptions
for the model to be used are valid. The assumptions for the ANOVA
are that the data are independent and come from normal populations
with equal variances (or standard deviations). In particular:
(a) Obtain the summary statistics (sample size, mean, standard...
 Please answer all of the following.
The boxplot below shows the number of contacts in their cell by gender for my Spring 2018 statistics classes. Using the boxplot, answer the 4 questions below. Boxplot of CellNumbers 900 800 700 600 500 400 300 200 100 0 Male Female Gender CellNumbers Which distribution has 3 outliers? Which distribution appears skewed right, excluding 1. Male 1 outliers? 2. Female Which distribution is 1 3. Both less variable (has the smaller IQR)? 4....
Please answer all of the following.
The boxplot below shows the number of contacts in their cell by gender for my Spring 2018 statistics classes. Using the boxplot, answer the 4 questions below. Boxplot of CellNumbers 900 800 700 600 500 400 300 200 100 0 Male Female Gender CellNumbers Which distribution has 3 outliers? Which distribution appears skewed right, excluding 1. Male 1 outliers? 2. Female Which distribution is 1 3. Both less variable (has the smaller IQR)? 4....
 Problem 1 The table below presents data for tire sales in the Costco Branch at South Dakota Avenue, Washington D.C. from the months of July through December of the Year 2017. Automobile Tire Sales 550 576 590 602 622 664 689 905 860 869 886 920 Y ear 2018 2018 2018 2018 2018 2018 2018 2018 2018 2018 2018 2018 Month Janua Februar March April June Jul August September October November December a. Compute a two-month moving average. What is...
 HELP needed urgently....Data and question is attacted below.....
Thank you in advance
there is no data link fir this data it’s all in photos.... thank
you
i
have already posted the question
We were unable to transcribe this imageNo. 2 3 4 5 6 7 8 Working Sector Public Own Public Public Private Public Private Private Own Own Private Public Public Public Private 9 10 11 12 13 Public IS 16 17 18 19 20 21 22 23 24 25...
HELP needed urgently....Data and question is attacted below.....
Thank you in advance
there is no data link fir this data it’s all in photos.... thank
you
i
have already posted the question
We were unable to transcribe this imageNo. 2 3 4 5 6 7 8 Working Sector Public Own Public Public Private Public Private Private Own Own Private Public Public Public Private 9 10 11 12 13 Public IS 16 17 18 19 20 21 22 23 24 25...
 Answer in order please thank you.
Question1 A survey was conducted from a random sample of 8225 Americans, and one Selecd variable that was recorded for each participant was their answer to the question, "How old are you?" 1o points The mean of this data was found to be 42, while the median was 37. What does this tell you about the shape of this distribution? A. O It is symmetric. B. O It is skewed left. C. There is...
Answer in order please thank you.
Question1 A survey was conducted from a random sample of 8225 Americans, and one Selecd variable that was recorded for each participant was their answer to the question, "How old are you?" 1o points The mean of this data was found to be 42, while the median was 37. What does this tell you about the shape of this distribution? A. O It is symmetric. B. O It is skewed left. C. There is...
 I am just wanting the first question answered.
Stat 255 Project 3 due Wednesday, April 22 Write R code to solve the following problems, Make sure to include descriptions and explanation in your cod Save them in a file named project3-yourname.R and email them to ysarolousi.edu be date. A model for stock prices Let S, be the closing price of a stock at the end of day j, where j model for the evolution of the future daily closing prices:...
I am just wanting the first question answered.
Stat 255 Project 3 due Wednesday, April 22 Write R code to solve the following problems, Make sure to include descriptions and explanation in your cod Save them in a file named project3-yourname.R and email them to ysarolousi.edu be date. A model for stock prices Let S, be the closing price of a stock at the end of day j, where j model for the evolution of the future daily closing prices:...
 QUESTION 27 Q27. A manager at a local bank analyzed the relationship between monthly salary (y, in $) and length of service (x, measured in months) for 30 employees. She estimates the model: Salary = Bo + B1 Service + ε. The following ANOVA table below shows a portion of the regression results. df SS M S F Regression 555,420 555,420 7.64 Residual 27 1,962,873 72,699 Total 28 2 ,518,293 Coefficients Standard Error t-stat p-value Intercept 784.92 322.25 2.44 0.02...
Most questions answered within 3 hours.
-
Where is the error in this code sequence?
String s1 = "Hello";
String s2 = "ello";...
asked 10 months ago -
Financial data for Joel de Paris, Inc., for last year
follow:
Joel de Paris, Inc.
Balance...
asked 10 months ago -
Consider this reaction:
Al2(SO4)3 (aq)+ BaCl3
(aq) Al2Cl6 (aq)- +
3BaSO4(s) . What is the...
asked 10 months ago -
Suppose that Savneet is considering increasing her
recent random sample from 20 car rentals to 40...
asked 10 months ago -
Trucks arrive at an unloading terminal at an average rate of 120
per hour.
Trucks arrive...
asked 10 months ago -
Why are methanol and ethanol completely soluble in water while
octanol is not very little soluble....
asked 10 months ago -
A facilities manager at a university reads in a research report
that the mean amount of...
asked 10 months ago -
When the CuSO4 is rehydrated by adding water to the anhydrous
compound, is this an endothermic...
asked 10 months ago -
A ray of sunlight is passing from diamond into crown glass; the
angle of incidence is...
asked 10 months ago -
A block of mass 0.249 kg is placed on top of a light, vertical
spring of...
asked 10 months ago -
how do the kidneys compensate in the presences of acidosis
a) trigger hyperventilate
b) reserve acid...
asked 10 months ago -
Question 501 pts
The rental rate of capital to the firm increases. Which of the
following...
asked 10 months ago