The design of controls and instruments has a large effect on how easily people can use...
The design of controls and instruments has a large effect on how easily people can use them. A student project investigated this effect by asking 25 right-handed students to turn a knob (with their right hands) that moved an indicator by screw action. There were two identical instruments, one with a right-hand thread (the knob turns clockwise) and the other with a left-hand thread (the knob turns counter-clockwise). The table below gives the times required (in seconds) to move the indicator a fixed distance.
|
Subject ID |
Right-hand Thread |
Left-hand Thread |
|
1 |
113 |
137 |
|
2 |
105 |
105 |
|
3 |
130 |
133 |
|
4 |
101 |
108 |
|
5 |
138 |
115 |
|
6 |
118 |
170 |
|
7 |
87 |
103 |
|
8 |
116 |
145 |
|
9 |
75 |
78 |
|
10 |
96 |
107 |
|
11 |
122 |
84 |
|
12 |
103 |
148 |
|
13 |
116 |
147 |
|
14 |
107 |
87 |
|
15 |
118 |
166 |
|
16 |
103 |
146 |
|
17 |
111 |
123 |
|
18 |
104 |
135 |
|
19 |
111 |
112 |
|
20 |
89 |
93 |
|
21 |
78 |
76 |
|
22 |
100 |
116 |
|
23 |
89 |
78 |
|
24 |
85 |
101 |
|
25 |
88 |
123 |
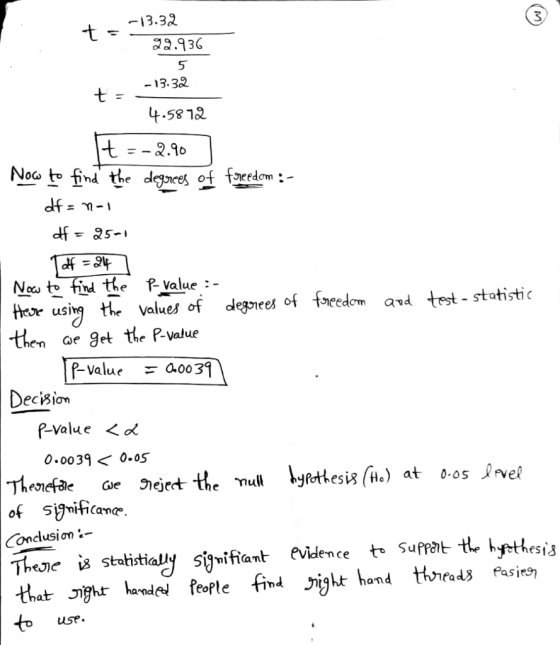
- The project hoped to show that right-handed people find right-hand threads easier to use. State the appropriate Ho and Ha about the mean time required to complete the task.
- Carry out a test of your hypotheses. Give the P-value, report and explain your conclusion in a brief paragraph.
Homework Answers


Add Answer to:
The design of controls and instruments has a large effect on how
easily people can use...
The design of controls and instruments affects how easily people can use them. A student project...
The design of controls and instruments affects how easily people can use them. A student project investigated this effect by asking 25 right‑handed students to turn a knob (with their right hands) that moved an indicator by screw action. There were two identical instruments, one with a right‑hand thread (the knob turns clockwise) and the other with a left‑hand thread (the knob turns counterclockwise). Each of the 25 students used both instruments. The table gives the times in seconds each...
Using the same information and data as was given in Problem 6, provide an 90% confidence...
Using the same information and data as was given in Problem 6, provide an 90% confidence interval for mean time advantage of right-hand over left-hand threads. Do you think that the time saved would be of practical importance if the task were performed many times - for example, by an assembly line worker? To help answer this question, find the mean time for right-hand threads as a percent of the mean time for left-hand threads. Be descriptive. by the same...
PLEASE ANSWER BOTH QUESTIONS AND USE DROP DOWN MENU, I HAVE INCLUDED THE DATA SET! THANK...
 PLEASE ANSWER BOTH QUESTIONS AND USE DROP DOWN MENU, I HAVE
INCLUDED THE DATA SET! THANK YOU
Subjects
Right-hand Thread
Left-hand Thread
1
86.2
123.3
2
106.5
97.8
3
74.5
104.0
4
83.8
101.6
5
154.3
140.7
6
127.1
99.0
7
106.9
131.7
8
99.8
91.2
9
111.8
115.6
10
118.8
123.2
11
120.6
127.8
12
142.3
111.7
13
76.4
130.7
14
145.5
121.0
15
124.4
138.7
16
119.6
133.1
17
122.8
107.8
18
85.5
99.4
19
118.3
149.1
20...
PLEASE ANSWER BOTH QUESTIONS AND USE DROP DOWN MENU, I HAVE
INCLUDED THE DATA SET! THANK YOU
Subjects
Right-hand Thread
Left-hand Thread
1
86.2
123.3
2
106.5
97.8
3
74.5
104.0
4
83.8
101.6
5
154.3
140.7
6
127.1
99.0
7
106.9
131.7
8
99.8
91.2
9
111.8
115.6
10
118.8
123.2
11
120.6
127.8
12
142.3
111.7
13
76.4
130.7
14
145.5
121.0
15
124.4
138.7
16
119.6
133.1
17
122.8
107.8
18
85.5
99.4
19
118.3
149.1
20...
ASAP HELP!! A test was given to 50 fourth grade students The scores for the students...
 ASAP HELP!!
A test was given to 50 fourth grade students The scores for the students are given below. 93 108 91 116 92 87 100 88 109 110 91 119 88 100 86 119 113 85 103 118 100 112 87 95 95 94 114 87 119 96 113 100 112 100 107 93 91 95 111 108 110 88 117 101 88 97 118 87 114 103 (a) Construct a grouped frequency distribution for the data. Use 85-89...
ASAP HELP!!
A test was given to 50 fourth grade students The scores for the students are given below. 93 108 91 116 92 87 100 88 109 110 91 119 88 100 86 119 113 85 103 118 100 112 87 95 95 94 114 87 119 96 113 100 112 100 107 93 91 95 111 108 110 88 117 101 88 97 118 87 114 103 (a) Construct a grouped frequency distribution for the data. Use 85-89...
How do I plot a series graph with this data provided? Month 1987 1988 1989 1990...
How do I plot a series graph with this data provided? Month 1987 1988 1989 1990 1991 1992 1993 1994 1995 1996 Jan 95 104 101 88 132 125 111 127 119 147 Feb 94 100 96 110 109 118 123 129 147 146 Mar 98 99 82 129 101 121 121 132 164 133 Apr 96 88 84 113 111 140 139 108 135 148 May 95 89 85 114 140 141 119 115 124 141 Jun 115 108...
Name Practice 4. Quiz 4 For the problems below, determine if data collection is Matched Pairs...
 Name Practice 4. Quiz 4 For the problems below, determine if data collection is Matched Pairs or Independent Samples 1 The design of controls and instruments has a large effect on how easily people can use them. A student project investigated this effect by asking 25 right-handed students to turn a knob (with their right hands) that moved an indicator by screw action. There were two identical instruments, one with a right-hand thread (the knob turns dockwise) and the other...
The data from data349.dat contains information on 78 seventh-grade students. We want to know how well each of IQ score a...
The data from data349.dat contains information on 78 seventh-grade students. We want to know how well each of IQ score and self-concept score predicts GPA using least-squares regression. We also want to know which of these explanatory variables predicts GPA better. Give numerical measures that answer these questions. (Round your answers to three decimal places.) (Regressor: IQ) R 2 (Regressor: Self-Concept) R 2 Which variable is the better predictor? IQ Self Concept obs gpa iq gender concept 1 7.94 112 ...
The data from data421.dat contains information on 78 seventh-grade students. We want to know how well...
The data from data421.dat contains information on 78 seventh-grade students. We want to know how well each of IQ score and self-concept score predicts GPA using least-squares regression. We also want to know which of these explanatory variables predicts GPA better. Give numerical measures that answer these questions. (Round your answers to three decimal places.) find:(Regressor: IQ) R 2 find: (Regressor: Self-Concept) R 2 obs gpa iq gender concept 1 7.94 103 2 54 2 8.292 111 2 73 3...
Final Project For this assignment, use data from W1 Assignment. Using Minitab. Give instructions on how...
Final Project For this assignment, use data from W1 Assignment. Using Minitab. Give instructions on how to insert data into Minitab. This week, you will explore the hypothesis that higher levels of stress are associated with lower levels of confidence. Compute the correlation between the stress score and confidence scores. StressScore Confidence 3 100 5 112 2 125 9 150 7 136 4 107 3 143 1 141 4 134 2 148 5 139 3 117 7 76 8 99...
The data from data95.dat contains information on 78 seventh-grade students. We want to know how well each of IQ score and self-concept score predicts GPA using least-squares regression. We also want t...
The data from data95.dat contains information on 78 seventh-grade students. We want to know how well each of IQ score and self-concept score predicts GPA using least-squares regression. We also want to know which of these explanatory variables predicts GPA better. Give numerical measures that answer these questions. (Round your answers to three decimal places.) (Regressor: IQ) R 2 : (Regressor: Self-Concept) R 2 : Which variable is the better predictor? IQSelf Concept obs gpa iq gender concept 1 7.94...
 PLEASE ANSWER BOTH QUESTIONS AND USE DROP DOWN MENU, I HAVE
INCLUDED THE DATA SET! THANK YOU
Subjects
Right-hand Thread
Left-hand Thread
1
86.2
123.3
2
106.5
97.8
3
74.5
104.0
4
83.8
101.6
5
154.3
140.7
6
127.1
99.0
7
106.9
131.7
8
99.8
91.2
9
111.8
115.6
10
118.8
123.2
11
120.6
127.8
12
142.3
111.7
13
76.4
130.7
14
145.5
121.0
15
124.4
138.7
16
119.6
133.1
17
122.8
107.8
18
85.5
99.4
19
118.3
149.1
20...
PLEASE ANSWER BOTH QUESTIONS AND USE DROP DOWN MENU, I HAVE
INCLUDED THE DATA SET! THANK YOU
Subjects
Right-hand Thread
Left-hand Thread
1
86.2
123.3
2
106.5
97.8
3
74.5
104.0
4
83.8
101.6
5
154.3
140.7
6
127.1
99.0
7
106.9
131.7
8
99.8
91.2
9
111.8
115.6
10
118.8
123.2
11
120.6
127.8
12
142.3
111.7
13
76.4
130.7
14
145.5
121.0
15
124.4
138.7
16
119.6
133.1
17
122.8
107.8
18
85.5
99.4
19
118.3
149.1
20...
 ASAP HELP!!
A test was given to 50 fourth grade students The scores for the students are given below. 93 108 91 116 92 87 100 88 109 110 91 119 88 100 86 119 113 85 103 118 100 112 87 95 95 94 114 87 119 96 113 100 112 100 107 93 91 95 111 108 110 88 117 101 88 97 118 87 114 103 (a) Construct a grouped frequency distribution for the data. Use 85-89...
ASAP HELP!!
A test was given to 50 fourth grade students The scores for the students are given below. 93 108 91 116 92 87 100 88 109 110 91 119 88 100 86 119 113 85 103 118 100 112 87 95 95 94 114 87 119 96 113 100 112 100 107 93 91 95 111 108 110 88 117 101 88 97 118 87 114 103 (a) Construct a grouped frequency distribution for the data. Use 85-89...
 Name Practice 4. Quiz 4 For the problems below, determine if data collection is Matched Pairs or Independent Samples 1 The design of controls and instruments has a large effect on how easily people can use them. A student project investigated this effect by asking 25 right-handed students to turn a knob (with their right hands) that moved an indicator by screw action. There were two identical instruments, one with a right-hand thread (the knob turns dockwise) and the other...
Most questions answered within 3 hours.
-
Where is the error in this code sequence?
String s1 = "Hello";
String s2 = "ello";...
asked 10 months ago -
Financial data for Joel de Paris, Inc., for last year
follow:
Joel de Paris, Inc.
Balance...
asked 10 months ago -
Consider this reaction:
Al2(SO4)3 (aq)+ BaCl3
(aq) Al2Cl6 (aq)- +
3BaSO4(s) . What is the...
asked 10 months ago -
Suppose that Savneet is considering increasing her
recent random sample from 20 car rentals to 40...
asked 10 months ago -
Trucks arrive at an unloading terminal at an average rate of 120
per hour.
Trucks arrive...
asked 10 months ago -
Why are methanol and ethanol completely soluble in water while
octanol is not very little soluble....
asked 10 months ago -
A facilities manager at a university reads in a research report
that the mean amount of...
asked 10 months ago -
When the CuSO4 is rehydrated by adding water to the anhydrous
compound, is this an endothermic...
asked 10 months ago -
A ray of sunlight is passing from diamond into crown glass; the
angle of incidence is...
asked 10 months ago -
A block of mass 0.249 kg is placed on top of a light, vertical
spring of...
asked 10 months ago -
how do the kidneys compensate in the presences of acidosis
a) trigger hyperventilate
b) reserve acid...
asked 10 months ago -
Question 501 pts
The rental rate of capital to the firm increases. Which of the
following...
asked 10 months ago