
Please analyze IR spectra values in detail for important functional groups/stretches/peaks that determine purity and identity of aspirin created from salicylic acid. Highlight differences between the 2 profiles. Thank you.
Homework Answers
Add Answer to:
Please analyze IR spectra values in detail for important
functional groups/stretches/peaks that determine purity and
identity...
Please analyze IR spectra values in detail for important functional groups/stretches/peaks that determine purity and identity...
 Please analyze IR spectra values in detail for important
functional groups/stretches/peaks that determine purity and
identity of acetaminophen created from 4-aminophenol. Highlight
differences between the 2 profiles. Thank you.
0 3500 3323321.42283 3277.06-55 3250 3163.26 3109.25+t 3000 2750 2500 2250 2000 1750 1500 250 161651.07 11608.63— 151560.41 -151504.48_1506 1471.69 1436.97-2 11371.39384 80 11327.034 1257.59 1224.80- 1172.72 109 1107.14 1014.560 9968.272 856.39 835837.11 806.256 7796.603 7711.73703 1 000 A acetaminophen std (tylenol) acetaminophen exp 01 (tylenol) 4-aminophenol std 01 7 50...
Please analyze IR spectra values in detail for important
functional groups/stretches/peaks that determine purity and
identity of acetaminophen created from 4-aminophenol. Highlight
differences between the 2 profiles. Thank you.
0 3500 3323321.42283 3277.06-55 3250 3163.26 3109.25+t 3000 2750 2500 2250 2000 1750 1500 250 161651.07 11608.63— 151560.41 -151504.48_1506 1471.69 1436.97-2 11371.39384 80 11327.034 1257.59 1224.80- 1172.72 109 1107.14 1014.560 9968.272 856.39 835837.11 806.256 7796.603 7711.73703 1 000 A acetaminophen std (tylenol) acetaminophen exp 01 (tylenol) 4-aminophenol std 01 7 50...
Please identify the main functional groups in the IR spectra of two different molecules. I can't...
 Please identify the main functional groups in the IR spectra of
two different molecules.
I can't figure out what the peaks in these IR signify. I don't
understand what the peak in the 3400 cm area of the second IR
is.
95 85 C(CH3)3 80 C(CH3)3 N OH 75- 'N OH C(CH3)3 70- C(CH3)3 65 60 4000 3750 3500 3250 3000 2750 2500 2250 2000 1750 1500 1250 1/cm 95 C(CH3)3 85 C(CHa)3 N C Mn Cl 80 75 70...
Please identify the main functional groups in the IR spectra of
two different molecules.
I can't figure out what the peaks in these IR signify. I don't
understand what the peak in the 3400 cm area of the second IR
is.
95 85 C(CH3)3 80 C(CH3)3 N OH 75- 'N OH C(CH3)3 70- C(CH3)3 65 60 4000 3750 3500 3250 3000 2750 2500 2250 2000 1750 1500 1250 1/cm 95 C(CH3)3 85 C(CHa)3 N C Mn Cl 80 75 70...
determine the IR GRAPH & label peaks LU 1000 750 500 1/cm 858 BIRE 4000 3750...
 determine the IR GRAPH & label peaks
LU 1000 750 500 1/cm 858 BIRE 4000 3750 3500 3250 3000 Barber Wilson 2750 2500 2250 2000 1750 1500 1250 1000 750 500
determine the IR GRAPH & label peaks
LU 1000 750 500 1/cm 858 BIRE 4000 3750 3500 3250 3000 Barber Wilson 2750 2500 2250 2000 1750 1500 1250 1000 750 500
please help me finish all the questions on the first picture, be sure to use the...
 please help me finish all the questions on the first picture, be
sure to use the IR scans I uploaded below and please label all the
functional group showed on the two IR scans. Thanks.
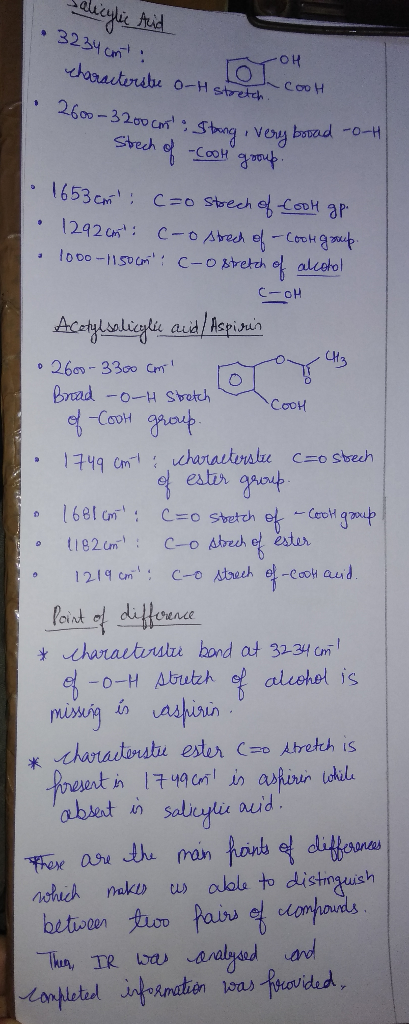
Exp. 11 Synthesis and Analysis of Aspirin 2. What functional group is created during the synthesis process that is found in aspirin, but not in salicylic acid? Draw aspirin structure and circle the group(s). 3. Consider both the IR scans of salicylic acid and aspirin....
please help me finish all the questions on the first picture, be
sure to use the IR scans I uploaded below and please label all the
functional group showed on the two IR scans. Thanks.
Exp. 11 Synthesis and Analysis of Aspirin 2. What functional group is created during the synthesis process that is found in aspirin, but not in salicylic acid? Draw aspirin structure and circle the group(s). 3. Consider both the IR scans of salicylic acid and aspirin....
IV. On each the following IR spectra, circle and indicate the most important stretching signals from...
 IV. On each the following IR spectra, circle and indicate the most important stretching signals from the following choices:N-H, O-H, C=N, C=C, C=0, C-O, (3 points each, 6 points total) Top, IR spectrum of Compound 23a: C10H120; Bottom, IR Spectrum of Compound 23b: C16H140 1.025 1.000 m 0.975 0.950 Transmitance 0.925 0.900 0.875 0.850 3750 3500 3250 3000 2750 2500 1750 1500 1250 1000 750 2250 2000 Wavenumbers (cm-1) 1.0 0.8 0.6 Transmitance N 0.2 0.0 4500 4000 3500 2000...
Analyze this IR spectra of o-vanillin, identifying key peaks and bonds of functional groups: 8 BRUKER...
 Analyze this IR spectra of o-vanillin, identifying key peaks and
bonds of functional groups:
8 BRUKER 8 8 3500 2500 Wavenumber cm-1 3000 2000 1500 1000
Analyze this IR spectra of o-vanillin, identifying key peaks and
bonds of functional groups:
8 BRUKER 8 8 3500 2500 Wavenumber cm-1 3000 2000 1500 1000
 Please analyze IR spectra values in detail for important
functional groups/stretches/peaks that determine purity and
identity of acetaminophen created from 4-aminophenol. Highlight
differences between the 2 profiles. Thank you.
0 3500 3323321.42283 3277.06-55 3250 3163.26 3109.25+t 3000 2750 2500 2250 2000 1750 1500 250 161651.07 11608.63— 151560.41 -151504.48_1506 1471.69 1436.97-2 11371.39384 80 11327.034 1257.59 1224.80- 1172.72 109 1107.14 1014.560 9968.272 856.39 835837.11 806.256 7796.603 7711.73703 1 000 A acetaminophen std (tylenol) acetaminophen exp 01 (tylenol) 4-aminophenol std 01 7 50...
Please analyze IR spectra values in detail for important
functional groups/stretches/peaks that determine purity and
identity of acetaminophen created from 4-aminophenol. Highlight
differences between the 2 profiles. Thank you.
0 3500 3323321.42283 3277.06-55 3250 3163.26 3109.25+t 3000 2750 2500 2250 2000 1750 1500 250 161651.07 11608.63— 151560.41 -151504.48_1506 1471.69 1436.97-2 11371.39384 80 11327.034 1257.59 1224.80- 1172.72 109 1107.14 1014.560 9968.272 856.39 835837.11 806.256 7796.603 7711.73703 1 000 A acetaminophen std (tylenol) acetaminophen exp 01 (tylenol) 4-aminophenol std 01 7 50...
 Please identify the main functional groups in the IR spectra of
two different molecules.
I can't figure out what the peaks in these IR signify. I don't
understand what the peak in the 3400 cm area of the second IR
is.
95 85 C(CH3)3 80 C(CH3)3 N OH 75- 'N OH C(CH3)3 70- C(CH3)3 65 60 4000 3750 3500 3250 3000 2750 2500 2250 2000 1750 1500 1250 1/cm 95 C(CH3)3 85 C(CHa)3 N C Mn Cl 80 75 70...
Please identify the main functional groups in the IR spectra of
two different molecules.
I can't figure out what the peaks in these IR signify. I don't
understand what the peak in the 3400 cm area of the second IR
is.
95 85 C(CH3)3 80 C(CH3)3 N OH 75- 'N OH C(CH3)3 70- C(CH3)3 65 60 4000 3750 3500 3250 3000 2750 2500 2250 2000 1750 1500 1250 1/cm 95 C(CH3)3 85 C(CHa)3 N C Mn Cl 80 75 70...
 determine the IR GRAPH & label peaks
LU 1000 750 500 1/cm 858 BIRE 4000 3750 3500 3250 3000 Barber Wilson 2750 2500 2250 2000 1750 1500 1250 1000 750 500
determine the IR GRAPH & label peaks
LU 1000 750 500 1/cm 858 BIRE 4000 3750 3500 3250 3000 Barber Wilson 2750 2500 2250 2000 1750 1500 1250 1000 750 500
 please help me finish all the questions on the first picture, be
sure to use the IR scans I uploaded below and please label all the
functional group showed on the two IR scans. Thanks.
Exp. 11 Synthesis and Analysis of Aspirin 2. What functional group is created during the synthesis process that is found in aspirin, but not in salicylic acid? Draw aspirin structure and circle the group(s). 3. Consider both the IR scans of salicylic acid and aspirin....
please help me finish all the questions on the first picture, be
sure to use the IR scans I uploaded below and please label all the
functional group showed on the two IR scans. Thanks.
Exp. 11 Synthesis and Analysis of Aspirin 2. What functional group is created during the synthesis process that is found in aspirin, but not in salicylic acid? Draw aspirin structure and circle the group(s). 3. Consider both the IR scans of salicylic acid and aspirin....
 IV. On each the following IR spectra, circle and indicate the most important stretching signals from the following choices:N-H, O-H, C=N, C=C, C=0, C-O, (3 points each, 6 points total) Top, IR spectrum of Compound 23a: C10H120; Bottom, IR Spectrum of Compound 23b: C16H140 1.025 1.000 m 0.975 0.950 Transmitance 0.925 0.900 0.875 0.850 3750 3500 3250 3000 2750 2500 1750 1500 1250 1000 750 2250 2000 Wavenumbers (cm-1) 1.0 0.8 0.6 Transmitance N 0.2 0.0 4500 4000 3500 2000...
 IV. On each the following IR spectra, circle and indicate the most important stretching signals from the following choices:N-H, O-H, C=N, C=C, C=0, C-O, (3 points each, 6 points total) Top, IR spectrum of Compound 23a: C10H120; Bottom, IR Spectrum of Compound 23b: C16H140 1.025 1.000 m 0.975 0.950 Transmitance 0.925 0.900 0.875 0.850 3750 3500 3250 3000 2750 2500 1750 1500 1250 1000 750 2250 2000 Wavenumbers (cm-1) 1.0 0.8 0.6 Transmitance N 0.2 0.0 4500 4000 3500 2000...
 Analyze this IR spectra of o-vanillin, identifying key peaks and
bonds of functional groups:
8 BRUKER 8 8 3500 2500 Wavenumber cm-1 3000 2000 1500 1000
Analyze this IR spectra of o-vanillin, identifying key peaks and
bonds of functional groups:
8 BRUKER 8 8 3500 2500 Wavenumber cm-1 3000 2000 1500 1000
Most questions answered within 3 hours.
-
Where is the error in this code sequence?
String s1 = "Hello";
String s2 = "ello";...
asked 10 months ago -
Financial data for Joel de Paris, Inc., for last year
follow:
Joel de Paris, Inc.
Balance...
asked 10 months ago -
Consider this reaction:
Al2(SO4)3 (aq)+ BaCl3
(aq) Al2Cl6 (aq)- +
3BaSO4(s) . What is the...
asked 10 months ago -
Suppose that Savneet is considering increasing her
recent random sample from 20 car rentals to 40...
asked 10 months ago -
Trucks arrive at an unloading terminal at an average rate of 120
per hour.
Trucks arrive...
asked 10 months ago -
Why are methanol and ethanol completely soluble in water while
octanol is not very little soluble....
asked 10 months ago -
A facilities manager at a university reads in a research report
that the mean amount of...
asked 10 months ago -
When the CuSO4 is rehydrated by adding water to the anhydrous
compound, is this an endothermic...
asked 10 months ago -
A ray of sunlight is passing from diamond into crown glass; the
angle of incidence is...
asked 10 months ago -
A block of mass 0.249 kg is placed on top of a light, vertical
spring of...
asked 10 months ago -
how do the kidneys compensate in the presences of acidosis
a) trigger hyperventilate
b) reserve acid...
asked 10 months ago -
Question 501 pts
The rental rate of capital to the firm increases. Which of the
following...
asked 10 months ago