determine the comcentration for all solutions.


Homework Answers
Following is the - complete Answer -&- Explanation: for the given: Question: in...typed format...
Answer:'
Concentration of Unknown:( when potential = 176 mV ) = 0.000591562 M ( mol/L )
i.e. as the table shown below, under Explanation, and under : Answer. below...
Explanation:
Following is the complete Explanation: for the above Answer.
- Given:
Following is the given: data set, in the form of a table: prepared by using MS Excel, presented in ...image format...

Note:
The above table, gives the values of the
potential ( in milli-volt, mV ) and the
corresponding, concentrations: of the
first solution: to the seventh
solution, as given: in...image
format...
Now,
we will have to make a calibration curve, i.e.
make a graph: of Potential ( mV ) vs.
Concentration ( mol/L ) of the given solutions, to
determine the : linear equation of the TrendLine,
and then use the Equation: to find the value of
the : Concentration: of the 3rd
solution: with given Potential ( 176 mV )
...
- Step - 1:
Using the above, table, we will have to take logaritms: of the given concentrations: to modify the above table: as required:
![Number of Solutions 82 Concentration of Solution, M (mol/L) Potential, mV (milli-volt) log [ concentration] 1.00E-01 1.00E-02](http://img.homeworklib.com/questions/d6536b70-703f-11ea-9d2d-e126746fb8e4.png?x-oss-process=image/resize,w_560)
- Step - 2:
Now, if we plot: the potential ( mV ) vs. log10 [conc. ] , based on the above table; we will get the following graph, prepared using MS Excel, presented here in......image format...
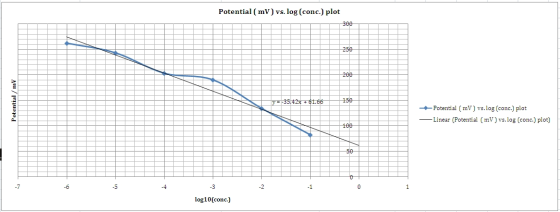
Linear
equation of : TrendLine: is... y =
-35.42 x + 61.66 -----------------Equation -
1
Where:
- y = potential [=] mV , milli-volt
- x = Logarithm ( base 10 ) , of the, given: concentrations , in M ( mol/L )
- Step - 3:
Now, if we plug-in: y = 176, in the above : Equation - 1, we will get the following value:
i.e.
x = Log10 (conc.)
= - 3.228 , i.e. when the
potential = 176 mV
- Step - 4:
If we take the anti-log: of the above value of ' x ', we would get the following, concentration:
i.e.
anti-log10 ( x ) = 10-3.228
= 5.9156 x 10⁻⁴ M ( mol/L )
= concentration...
- Answer:
Therefore, the following table: prepared by using MS Excel, presented in...image format...will be our Answer...

As
we have found above: the concentration, when the
value of : potential = 176 mV , will be the
following:
Concentration
of Unknown:( when potential = 176 mV ) =
0.000591562 M ( mol/L )
Add Answer to:
determine the comcentration for all solutions.
Solution: Potential: 102M 82 mV 10-'M 134 mV 104M 190...
Potential (mV) [Br](M) 0.300 Calibration data for a bromide ion-selective electrode (ISE) was collected and recorded in...
 Potential (mV) [Br](M) 0.300 Calibration data for a bromide ion-selective electrode (ISE) was collected and recorded in the table. The potential of the ISE was measured against a saturated calomel electrode (SCE). All solutions were buffered at a pH of 7.56. A linear calibration curve can be constructed from this data as a plot of potential (in mV) vs. pBr. Determine the slope and y-intercept of such a plot of the calibration data given. -21.2 0.0300 36.2 95.7 0.00300 0.000300...
Calculate the concentrations for the values with an asterisk beside them. Solution: Potential: 10-4M 26 mV...
 Calculate the concentrations for the values with an asterisk
beside them.
Solution: Potential: 10-4M 26 mV 10-2M 68 mV 10-3M 111 mV 10-4M 163 mV 10-SM 210 mV 10-M 254 mV Unexpired (Beginning of Tube) 107 mV* Unexpired (End of Tube) 108 mV* Expired (Beginning of Tube) 104 mV* Expired (End of Tube) 112 mV* 68 111 163 210 254 Calibration Curve -7 -6 -5 -4 -3 -2 -1 0
Calculate the concentrations for the values with an asterisk
beside them.
Solution: Potential: 10-4M 26 mV 10-2M 68 mV 10-3M 111 mV 10-4M 163 mV 10-SM 210 mV 10-M 254 mV Unexpired (Beginning of Tube) 107 mV* Unexpired (End of Tube) 108 mV* Expired (Beginning of Tube) 104 mV* Expired (End of Tube) 112 mV* 68 111 163 210 254 Calibration Curve -7 -6 -5 -4 -3 -2 -1 0
33 On May 6, Jim Ryan borrowed $14,000 from Lane Bank at 7 % interest. Jim...
 33 On May 6, Jim Ryan borrowed $14,000 from Lane Bank at 7 % interest. Jim plans to repay the loan on March 11. Assume the loan is on ordinary interest. How much will Jim repay on March 11? (Use Days in a year table) (Round your answer to the nearest cent.) Jm repay etbook 7-1 TABLE Exact days-in-a-year calendar (excluding leap year)" Day of month 30 31 30 31 28 31 30 31 31 30 31 31 Dec Mar...
i have also attached the solutions. could you please explain step by step what they are...
 i have also attached the solutions.
could you please explain step by step what they are doing.
especially the bit in part (a) where they do x/d
Question 2 Picture it. It's 5 o'clock on Friday and at the end of a long week all Dave wants to do is go home. But his boss has other ideas; he tells Dave that he can go once he has designed the tension reinforcement for the beam in Figure 2. a) Design...
i have also attached the solutions.
could you please explain step by step what they are doing.
especially the bit in part (a) where they do x/d
Question 2 Picture it. It's 5 o'clock on Friday and at the end of a long week all Dave wants to do is go home. But his boss has other ideas; he tells Dave that he can go once he has designed the tension reinforcement for the beam in Figure 2. a) Design...
Hi it's python I imported a data which are so many words in txt and I arranged and reshaped with ...
 Hi it's python I imported a data which are so many words in txt
and I arranged and reshaped with alphabetically both rows and
columns
I was successful with these steps but I am stuck with next
step
below is my code and screenshot
import numpy as np
import pandas as pd
data=pd.read_csv("/Users/superman/Downloads/words_file2.txt",header=None)
df_input=pd.DataFrame(data)
df_output=pd.DataFrame(np.arange(676).reshape((26,26)),
index =
['a','b','c','d','e','f','g','h','i','j','k','l','m','n','o','p','q','r','s','t','u','v','w','x','y','z'],
columns =
['a','b','c','d','e','f','g','h','i','j','k','l','m','n','o','p','q','r','s','t','u','v','w','x','y','z'])
df_output.index.name="Start"
df_output.columns.name="End"
df_output
This below screen shot is what I have to find
I have to find each word...
Hi it's python I imported a data which are so many words in txt
and I arranged and reshaped with alphabetically both rows and
columns
I was successful with these steps but I am stuck with next
step
below is my code and screenshot
import numpy as np
import pandas as pd
data=pd.read_csv("/Users/superman/Downloads/words_file2.txt",header=None)
df_input=pd.DataFrame(data)
df_output=pd.DataFrame(np.arange(676).reshape((26,26)),
index =
['a','b','c','d','e','f','g','h','i','j','k','l','m','n','o','p','q','r','s','t','u','v','w','x','y','z'],
columns =
['a','b','c','d','e','f','g','h','i','j','k','l','m','n','o','p','q','r','s','t','u','v','w','x','y','z'])
df_output.index.name="Start"
df_output.columns.name="End"
df_output
This below screen shot is what I have to find
I have to find each word...
40kN Uniform Load W kN/m X Span L L/2 Figure 1 SPAN L 6 W 11Kn/m Beam is 200 UB 18.2 Use the diagram above and the W an...
 40kN Uniform Load W kN/m X Span L L/2 Figure 1 SPAN L 6 W 11Kn/m Beam is 200 UB 18.2 Use the diagram above and the W and L values assigned to you to: a) Use your shear force diagram to calculate the Maximum longitudinal Shear Stress and where it occ Ccurs. b) Calculate the longitudinal Shear Stress at d/4 from the neutral axis. Check Figures 283 below this table BENDING MOMENT DIAGLAM Kp/m f:40 zm 7.5 KN-M 90...
need help to complete this java program // add appropriate import statements here. // These imports...
need help to complete this java program // add appropriate import statements here. // These imports you can leave as is. import javafx.application.Application; import javafx.scene.Group; import javafx.scene.Scene; import javafx.scene.canvas.Canvas; import javafx.scene.canvas.GraphicsContext; import javafx.scene.paint.Color; import javafx.stage.Stage; /** @author yourAccountNameHere */ public class ConnectTheDots extends Application { /* * Do not add code to main(). Add it below in connectTheDots instead. */ public static void main(String[] args) { launch(args); } /*...
Please determine the IDENTITY of the unknown compound and explain how each peak / data point...
 Please determine the IDENTITY of the unknown
compound and explain how each peak / data point from the following
instruments led to that identification. What does the gcms
indicate. Thank you very much! (The GCMS data is just a long set of
numbers which is why the question appears so long).
IR of unknown:
NMR unknown Proton Graphs (first is overall graph,
others that follow are zoomed in sections):
NMR unknown Carbon Graphs (first is overall graph,
others that follow...
Please determine the IDENTITY of the unknown
compound and explain how each peak / data point from the following
instruments led to that identification. What does the gcms
indicate. Thank you very much! (The GCMS data is just a long set of
numbers which is why the question appears so long).
IR of unknown:
NMR unknown Proton Graphs (first is overall graph,
others that follow are zoomed in sections):
NMR unknown Carbon Graphs (first is overall graph,
others that follow...
In C++ Programming: Using a single for loop, output the even numbers between 2 and 1004...
In C++ Programming: Using a single for loop, output the even numbers between 2 and 1004 (inclusive) that iterates (loops) exactly 502 times. The outputted numbers be aligned in a table with 10 numbers per row. Each column in the table should be 5 characters wide. Do not nest a loop inside of another loop. Hint: First create and test the code that output the numbers all on one line (the command line will automatically wrap the output to new...
find v belt drive design power select belt type determine shive size (belt speed 4000 ft/min)...
 find v belt drive
design power
select belt type
determine shive size (belt speed 4000 ft/min)
find shive size from power rating figure
find rated power
find estimated centre distance
find belt length (by selecting standard belt length)
calculate actual centre distance
find contact angle for small shieve
determine correct factors
calculate correct power per belt
no. of belt needed
V-Belt Designing Sample Problem . Given: A 4 cylinder diesel engine runs at 80 hp, 1800 rpm, to drive a...
find v belt drive
design power
select belt type
determine shive size (belt speed 4000 ft/min)
find shive size from power rating figure
find rated power
find estimated centre distance
find belt length (by selecting standard belt length)
calculate actual centre distance
find contact angle for small shieve
determine correct factors
calculate correct power per belt
no. of belt needed
V-Belt Designing Sample Problem . Given: A 4 cylinder diesel engine runs at 80 hp, 1800 rpm, to drive a...
 Potential (mV) [Br](M) 0.300 Calibration data for a bromide ion-selective electrode (ISE) was collected and recorded in the table. The potential of the ISE was measured against a saturated calomel electrode (SCE). All solutions were buffered at a pH of 7.56. A linear calibration curve can be constructed from this data as a plot of potential (in mV) vs. pBr. Determine the slope and y-intercept of such a plot of the calibration data given. -21.2 0.0300 36.2 95.7 0.00300 0.000300...
 Calculate the concentrations for the values with an asterisk
beside them.
Solution: Potential: 10-4M 26 mV 10-2M 68 mV 10-3M 111 mV 10-4M 163 mV 10-SM 210 mV 10-M 254 mV Unexpired (Beginning of Tube) 107 mV* Unexpired (End of Tube) 108 mV* Expired (Beginning of Tube) 104 mV* Expired (End of Tube) 112 mV* 68 111 163 210 254 Calibration Curve -7 -6 -5 -4 -3 -2 -1 0
Calculate the concentrations for the values with an asterisk
beside them.
Solution: Potential: 10-4M 26 mV 10-2M 68 mV 10-3M 111 mV 10-4M 163 mV 10-SM 210 mV 10-M 254 mV Unexpired (Beginning of Tube) 107 mV* Unexpired (End of Tube) 108 mV* Expired (Beginning of Tube) 104 mV* Expired (End of Tube) 112 mV* 68 111 163 210 254 Calibration Curve -7 -6 -5 -4 -3 -2 -1 0
 33 On May 6, Jim Ryan borrowed $14,000 from Lane Bank at 7 % interest. Jim plans to repay the loan on March 11. Assume the loan is on ordinary interest. How much will Jim repay on March 11? (Use Days in a year table) (Round your answer to the nearest cent.) Jm repay etbook 7-1 TABLE Exact days-in-a-year calendar (excluding leap year)" Day of month 30 31 30 31 28 31 30 31 31 30 31 31 Dec Mar...
 i have also attached the solutions.
could you please explain step by step what they are doing.
especially the bit in part (a) where they do x/d
Question 2 Picture it. It's 5 o'clock on Friday and at the end of a long week all Dave wants to do is go home. But his boss has other ideas; he tells Dave that he can go once he has designed the tension reinforcement for the beam in Figure 2. a) Design...
i have also attached the solutions.
could you please explain step by step what they are doing.
especially the bit in part (a) where they do x/d
Question 2 Picture it. It's 5 o'clock on Friday and at the end of a long week all Dave wants to do is go home. But his boss has other ideas; he tells Dave that he can go once he has designed the tension reinforcement for the beam in Figure 2. a) Design...
 Hi it's python I imported a data which are so many words in txt
and I arranged and reshaped with alphabetically both rows and
columns
I was successful with these steps but I am stuck with next
step
below is my code and screenshot
import numpy as np
import pandas as pd
data=pd.read_csv("/Users/superman/Downloads/words_file2.txt",header=None)
df_input=pd.DataFrame(data)
df_output=pd.DataFrame(np.arange(676).reshape((26,26)),
index =
['a','b','c','d','e','f','g','h','i','j','k','l','m','n','o','p','q','r','s','t','u','v','w','x','y','z'],
columns =
['a','b','c','d','e','f','g','h','i','j','k','l','m','n','o','p','q','r','s','t','u','v','w','x','y','z'])
df_output.index.name="Start"
df_output.columns.name="End"
df_output
This below screen shot is what I have to find
I have to find each word...
Hi it's python I imported a data which are so many words in txt
and I arranged and reshaped with alphabetically both rows and
columns
I was successful with these steps but I am stuck with next
step
below is my code and screenshot
import numpy as np
import pandas as pd
data=pd.read_csv("/Users/superman/Downloads/words_file2.txt",header=None)
df_input=pd.DataFrame(data)
df_output=pd.DataFrame(np.arange(676).reshape((26,26)),
index =
['a','b','c','d','e','f','g','h','i','j','k','l','m','n','o','p','q','r','s','t','u','v','w','x','y','z'],
columns =
['a','b','c','d','e','f','g','h','i','j','k','l','m','n','o','p','q','r','s','t','u','v','w','x','y','z'])
df_output.index.name="Start"
df_output.columns.name="End"
df_output
This below screen shot is what I have to find
I have to find each word...
 40kN Uniform Load W kN/m X Span L L/2 Figure 1 SPAN L 6 W 11Kn/m Beam is 200 UB 18.2 Use the diagram above and the W and L values assigned to you to: a) Use your shear force diagram to calculate the Maximum longitudinal Shear Stress and where it occ Ccurs. b) Calculate the longitudinal Shear Stress at d/4 from the neutral axis. Check Figures 283 below this table BENDING MOMENT DIAGLAM Kp/m f:40 zm 7.5 KN-M 90...
 Please determine the IDENTITY of the unknown
compound and explain how each peak / data point from the following
instruments led to that identification. What does the gcms
indicate. Thank you very much! (The GCMS data is just a long set of
numbers which is why the question appears so long).
IR of unknown:
NMR unknown Proton Graphs (first is overall graph,
others that follow are zoomed in sections):
NMR unknown Carbon Graphs (first is overall graph,
others that follow...
Please determine the IDENTITY of the unknown
compound and explain how each peak / data point from the following
instruments led to that identification. What does the gcms
indicate. Thank you very much! (The GCMS data is just a long set of
numbers which is why the question appears so long).
IR of unknown:
NMR unknown Proton Graphs (first is overall graph,
others that follow are zoomed in sections):
NMR unknown Carbon Graphs (first is overall graph,
others that follow...
 find v belt drive
design power
select belt type
determine shive size (belt speed 4000 ft/min)
find shive size from power rating figure
find rated power
find estimated centre distance
find belt length (by selecting standard belt length)
calculate actual centre distance
find contact angle for small shieve
determine correct factors
calculate correct power per belt
no. of belt needed
V-Belt Designing Sample Problem . Given: A 4 cylinder diesel engine runs at 80 hp, 1800 rpm, to drive a...
find v belt drive
design power
select belt type
determine shive size (belt speed 4000 ft/min)
find shive size from power rating figure
find rated power
find estimated centre distance
find belt length (by selecting standard belt length)
calculate actual centre distance
find contact angle for small shieve
determine correct factors
calculate correct power per belt
no. of belt needed
V-Belt Designing Sample Problem . Given: A 4 cylinder diesel engine runs at 80 hp, 1800 rpm, to drive a...
Most questions answered within 3 hours.
-
Where is the error in this code sequence?
String s1 = "Hello";
String s2 = "ello";...
asked 10 months ago -
Financial data for Joel de Paris, Inc., for last year
follow:
Joel de Paris, Inc.
Balance...
asked 10 months ago -
Consider this reaction:
Al2(SO4)3 (aq)+ BaCl3
(aq) Al2Cl6 (aq)- +
3BaSO4(s) . What is the...
asked 10 months ago -
Suppose that Savneet is considering increasing her
recent random sample from 20 car rentals to 40...
asked 10 months ago -
Trucks arrive at an unloading terminal at an average rate of 120
per hour.
Trucks arrive...
asked 10 months ago -
Why are methanol and ethanol completely soluble in water while
octanol is not very little soluble....
asked 10 months ago -
A facilities manager at a university reads in a research report
that the mean amount of...
asked 10 months ago -
When the CuSO4 is rehydrated by adding water to the anhydrous
compound, is this an endothermic...
asked 10 months ago -
A ray of sunlight is passing from diamond into crown glass; the
angle of incidence is...
asked 10 months ago -
A block of mass 0.249 kg is placed on top of a light, vertical
spring of...
asked 10 months ago -
how do the kidneys compensate in the presences of acidosis
a) trigger hyperventilate
b) reserve acid...
asked 10 months ago -
Question 501 pts
The rental rate of capital to the firm increases. Which of the
following...
asked 10 months ago