

Homework Answers

Interpretation:
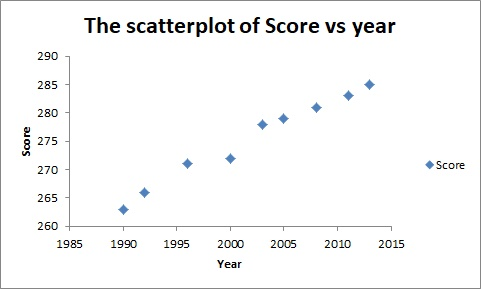
The scatter plot enables that the two quantitative variables Year (X) and Score (Y) are positively linearly correlated.
The direction of the two variables is the same and the plot showing the upward linear trend. The trend is slow linear increasing trend.
------------------------------------------------------------------------------------------------------------------------------------------------


-------------------------------------------------------------------------------------------------------------------------------------------------


The Interpretation of
the coefficient of determination,:
The value of the coefficient of
determination of the scatter plot of the simple linear regression
line is indicates
that the percentage of the variation in the dependent variable
(Y) can be explained by the independent variable Year
(X). The percent of the year-to-year variation in scores
is explained by the linear trend.
Add Answer to:
Just need help with part (b)
Every few years, the National Assessment of Educational Progress asks...
Every few years, the National Assessment of Educational Progress asks a national sample of eighth-graders to...
Every few years, the National Assessment of Educational Progress asks a national sample of eighth-graders to perform the same math tasks. The goal is to get an honest picture of progress in math. Suppose these are the last few national mean scores, on a scale of 0 to 500. Year 1990 1992 1996 2000 2003 2005 2008 2011 2013 Score 262 266 272 273 277 278 280 286 288 (b) Find the regression line of mean score on time step-by-step....
Does anybody know what I am doing wrong? Even got the equation from Excel... Every few...
 Does anybody know what I am
doing wrong? Even got the equation from Excel...
Every few years, the National Assessment of Educational Frogress asks a national sample of eighth-gracers to perform the same matn tasks. The g0 is to get an honest picture of progress in mธ廿. Suppose these are the last few national mean scores, on scale cr u to SOD. 2013 rear Score 265 200 280 285 287 (a] Make a time plot of the meer scores, by...
Does anybody know what I am
doing wrong? Even got the equation from Excel...
Every few years, the National Assessment of Educational Frogress asks a national sample of eighth-gracers to perform the same matn tasks. The g0 is to get an honest picture of progress in mธ廿. Suppose these are the last few national mean scores, on scale cr u to SOD. 2013 rear Score 265 200 280 285 287 (a] Make a time plot of the meer scores, by...
The National Assessment of Educational Progress (NAEP) administered a reading test to a nationwide probability sample...
The National Assessment of Educational Progress (NAEP) administered a reading test to a nationwide probability sample of 9-year-olds in 2010. The same test was administered to an independently chosen sample of 9-year-olds in 2020. There appears to have been some improvement: in 2010, the average score was 68.3 out of 100, while in 2020 the average score was 69.0 out of 100. Or could this be explained as a chance variation? Explain your reasoning. You may assume the NAEP took...
The scores of 12th-grade students on the National Assessment of Educational Progress year 2000 mathematics test...
The scores of 12th-grade students on the National Assessment of Educational Progress year 2000 mathematics test have a distribution that is approximately Normal with mean μ = 313 and standard deviation σ = 33 . Choose one 12th-grader at random. What is the probability (±±0.1, that is round to one decimal place) that his or her score is higher than 313 ? Higher than 412 (±±0.0001; that is round to 4 decimal places)? Now choose an SRS of 16 twelfth-graders and...
HELP needed urgently....Data and question is attacted below..... Thank you in advance there is no data...
 HELP needed urgently....Data and question is attacted below.....
Thank you in advance
there is no data link fir this data it’s all in photos.... thank
you
i
have already posted the question
We were unable to transcribe this imageNo. 2 3 4 5 6 7 8 Working Sector Public Own Public Public Private Public Private Private Own Own Private Public Public Public Private 9 10 11 12 13 Public IS 16 17 18 19 20 21 22 23 24 25...
HELP needed urgently....Data and question is attacted below.....
Thank you in advance
there is no data link fir this data it’s all in photos.... thank
you
i
have already posted the question
We were unable to transcribe this imageNo. 2 3 4 5 6 7 8 Working Sector Public Own Public Public Private Public Private Private Own Own Private Public Public Public Private 9 10 11 12 13 Public IS 16 17 18 19 20 21 22 23 24 25...
Given the value line: a.) what is the top line growth for 2015? b.)Bottom-Line? c.) Annual...
 Given the value line:
a.) what is the top line growth for 2015?
b.)Bottom-Line?
c.) Annual dividen per share?
d.) Current ratio in 2014?
e.) % bonds of Captial structure
f.) p/e ratio
g.) beta
h.) EBITDA %
I.) Long-Debt % change 2015
We were unable to transcribe this image41.65 TO 20.1 (Media 92) ATM 1.12 ** 3.4% YAKE 1965 07 2:22. 87 3. 35.8 COCA-COLA NYSE:KO TIMELINESS 4 Lowered 70115 h: 289 29 SAFETY . 1 New 727190 LEGENDS...
Given the value line:
a.) what is the top line growth for 2015?
b.)Bottom-Line?
c.) Annual dividen per share?
d.) Current ratio in 2014?
e.) % bonds of Captial structure
f.) p/e ratio
g.) beta
h.) EBITDA %
I.) Long-Debt % change 2015
We were unable to transcribe this image41.65 TO 20.1 (Media 92) ATM 1.12 ** 3.4% YAKE 1965 07 2:22. 87 3. 35.8 COCA-COLA NYSE:KO TIMELINESS 4 Lowered 70115 h: 289 29 SAFETY . 1 New 727190 LEGENDS...
 Does anybody know what I am
doing wrong? Even got the equation from Excel...
Every few years, the National Assessment of Educational Frogress asks a national sample of eighth-gracers to perform the same matn tasks. The g0 is to get an honest picture of progress in mธ廿. Suppose these are the last few national mean scores, on scale cr u to SOD. 2013 rear Score 265 200 280 285 287 (a] Make a time plot of the meer scores, by...
Does anybody know what I am
doing wrong? Even got the equation from Excel...
Every few years, the National Assessment of Educational Frogress asks a national sample of eighth-gracers to perform the same matn tasks. The g0 is to get an honest picture of progress in mธ廿. Suppose these are the last few national mean scores, on scale cr u to SOD. 2013 rear Score 265 200 280 285 287 (a] Make a time plot of the meer scores, by...
 HELP needed urgently....Data and question is attacted below.....
Thank you in advance
there is no data link fir this data it’s all in photos.... thank
you
i
have already posted the question
We were unable to transcribe this imageNo. 2 3 4 5 6 7 8 Working Sector Public Own Public Public Private Public Private Private Own Own Private Public Public Public Private 9 10 11 12 13 Public IS 16 17 18 19 20 21 22 23 24 25...
HELP needed urgently....Data and question is attacted below.....
Thank you in advance
there is no data link fir this data it’s all in photos.... thank
you
i
have already posted the question
We were unable to transcribe this imageNo. 2 3 4 5 6 7 8 Working Sector Public Own Public Public Private Public Private Private Own Own Private Public Public Public Private 9 10 11 12 13 Public IS 16 17 18 19 20 21 22 23 24 25...
 Given the value line:
a.) what is the top line growth for 2015?
b.)Bottom-Line?
c.) Annual dividen per share?
d.) Current ratio in 2014?
e.) % bonds of Captial structure
f.) p/e ratio
g.) beta
h.) EBITDA %
I.) Long-Debt % change 2015
We were unable to transcribe this image41.65 TO 20.1 (Media 92) ATM 1.12 ** 3.4% YAKE 1965 07 2:22. 87 3. 35.8 COCA-COLA NYSE:KO TIMELINESS 4 Lowered 70115 h: 289 29 SAFETY . 1 New 727190 LEGENDS...
Given the value line:
a.) what is the top line growth for 2015?
b.)Bottom-Line?
c.) Annual dividen per share?
d.) Current ratio in 2014?
e.) % bonds of Captial structure
f.) p/e ratio
g.) beta
h.) EBITDA %
I.) Long-Debt % change 2015
We were unable to transcribe this image41.65 TO 20.1 (Media 92) ATM 1.12 ** 3.4% YAKE 1965 07 2:22. 87 3. 35.8 COCA-COLA NYSE:KO TIMELINESS 4 Lowered 70115 h: 289 29 SAFETY . 1 New 727190 LEGENDS...
Most questions answered within 3 hours.
-
Where is the error in this code sequence?
String s1 = "Hello";
String s2 = "ello";...
asked 10 months ago -
Financial data for Joel de Paris, Inc., for last year
follow:
Joel de Paris, Inc.
Balance...
asked 10 months ago -
Consider this reaction:
Al2(SO4)3 (aq)+ BaCl3
(aq) Al2Cl6 (aq)- +
3BaSO4(s) . What is the...
asked 10 months ago -
Suppose that Savneet is considering increasing her
recent random sample from 20 car rentals to 40...
asked 10 months ago -
Trucks arrive at an unloading terminal at an average rate of 120
per hour.
Trucks arrive...
asked 10 months ago -
Why are methanol and ethanol completely soluble in water while
octanol is not very little soluble....
asked 10 months ago -
A facilities manager at a university reads in a research report
that the mean amount of...
asked 10 months ago -
When the CuSO4 is rehydrated by adding water to the anhydrous
compound, is this an endothermic...
asked 10 months ago -
A ray of sunlight is passing from diamond into crown glass; the
angle of incidence is...
asked 10 months ago -
A block of mass 0.249 kg is placed on top of a light, vertical
spring of...
asked 10 months ago -
how do the kidneys compensate in the presences of acidosis
a) trigger hyperventilate
b) reserve acid...
asked 10 months ago -
Question 501 pts
The rental rate of capital to the firm increases. Which of the
following...
asked 10 months ago