
Homework Answers
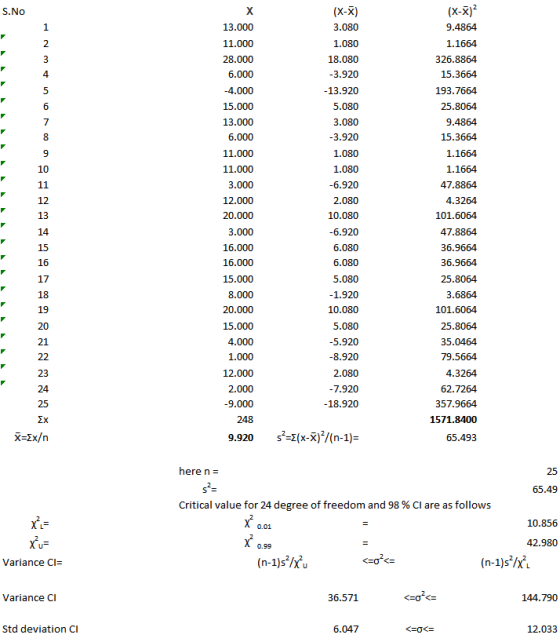
from above 98% confidence interval for population variance =36.571 to 144.790
98% confidence interval for population standard deviation =6.047 to 12.033
Add Answer to:
5.6.11. The rates of return (rounded to the nearest percentage) for 25 clients of a financial...
Hw Score: 65.63%, 10.5 of 16 pts Score: 0 of 1 pt Question Help 6.4.17 Pulse Rates The pulse rates of a random sample of 16 adults are shown in the dot plot. Assume the sample is 90% confidence i...
 Hw Score: 65.63%, 10.5 of 16 pts Score: 0 of 1 pt Question Help 6.4.17 Pulse Rates The pulse rates of a random sample of 16 adults are shown in the dot plot. Assume the sample is 90% confidence intervals for (a) the population variance σ2 and (b) the population standard deviation σ. Interpret the results. 60 65 70 75 80 85 L (Round to one decimal place as needed.) Enter your answer in the edit fields and then click...
The rates of return on Cherry Jalopies, Inc., stock over the last five years were 19...
 The rates of return on Cherry Jalopies, Inc., stock over the last five years were 19 percent, 11 percent, -1 percent, 3 percent, and 12 percent. Over the same period, the returns on Straw Construction Company's stock were 16 percent, 20 percent,-4 percent, 3 percent, and 20 percent. Calculate the variances and the standard deviations for Cherry and Straw. (Do not round intermediate calculations. Enter your variance as a decimal rounded to 5 decimal places. Enter your standard deviation as...
The rates of return on Cherry Jalopies, Inc., stock over the last five years were 19...
The rates of return on Cherry Jalopies, Inc., stock over the last five years were 19 percent, 11 percent, −1 percent, 3 percent, and 12 percent. Over the same period, the returns on Straw Construction Company’s stock were 16 percent, 20 percent, −4 percent, 3 percent, and 20 percent. Calculate the variances and the standard deviations for Cherry and Straw. (Do not round intermediate calculations. Enter your variance as a decimal rounded to 5 decimal places. Enter your standard deviation...
The rates of return on Cherry Jalopies, Inc., stock over the last five years were 20...
The rates of return on Cherry Jalopies, Inc., stock over the last five years were 20 percent, 11 percent, −6 percent, 5 percent, and 8 percent. Over the same period, the returns on Straw Construction Company’s stock were 16 percent, 19 percent, −3 percent, 2 percent, and 15 percent. Calculate the variances and the standard deviations for Cherry and Straw. (do not round intermediate calculations. Enter your variance as a decimal rounded to 5 decimal places. Enter your standard deviation...
1. Consider the following POPULATION of quiz scores {18, 23, 7, 20, 15, 12, 6, 23,...
 1. Consider the following POPULATION of quiz scores {18, 23, 7,
20, 15, 12, 6, 23, 17, 16 }
Compute the following: the mean ,μ, the variance, σ2, the
standarddeviation, σ.
State the mode, if one exists __________
ApplytheEmpiricalRuleatthe95%level.
What percentage of these Quiz Scores actually lie within the
interval found in part c? _________________________
II. Again consider the given Quiz Scores: {18, 23, 7, 20, 15,
12, 6, 23, 17, 16 }
Determine Q1, the median, and Q3:
Draw...
1. Consider the following POPULATION of quiz scores {18, 23, 7,
20, 15, 12, 6, 23, 17, 16 }
Compute the following: the mean ,μ, the variance, σ2, the
standarddeviation, σ.
State the mode, if one exists __________
ApplytheEmpiricalRuleatthe95%level.
What percentage of these Quiz Scores actually lie within the
interval found in part c? _________________________
II. Again consider the given Quiz Scores: {18, 23, 7, 20, 15,
12, 6, 23, 17, 16 }
Determine Q1, the median, and Q3:
Draw...
The rates of return on Cherry Jalopies, Inc., stock over the last five years were 12...
 The rates of return on Cherry Jalopies, Inc., stock over the last five years were 12 percent, 11 percent, -3 percent, 2 percent, and 6 percent. Over the same period, the returns on Straw Construction Company's stock were 16 percent, 17 percent, -6 percent, 4 percent, and 9 percent Calculate the variances and the standard deviations for Cherry and Straw. (Do not round intermediate calculations. Enter your variance as a decimal rounded to 5 decimal places. Enter your standard deviation...
Round to 4th decimal place, if needed A data set is as the following 8 1012...
 Round to 4th decimal place, if needed A data set is as the following 8 1012 12 1214 14 141414 16 16 18 18 20 20 20 22 30 35 What is the mean? 2.What is the median? What is the variance, if this is a sample? What is the variance, if this is a population? Does it skew? (Right, Left, or Not) 5. A sample set is as the following with a missing value x110 12 12 12 1414...
Determine the unit price rounded to the nearest cent. 5. $2.08 for 14 oz. Math 5....
 Determine the unit price rounded to the nearest cent. 5. $2.08 for 14 oz. Math 5. Determine whether this proportion is true or false. 5 3 6. Math =- 6. 22 13 Check Solve these proportions and check. 15 21 =- 7. Math 7. 14 Check 0.5 8. 11 8. Fm 22 Math Check Determine whether this proportion is true or false. 5 3 6. Math =- 6. 22 13 Check Solve these proportions and check. 15 21 =- 7....
Question 1. Thirty graduate students were asked how many credit hours they were taking in the...
Question 1. Thirty graduate students were asked how many credit hours they were taking in the current quarter. Download the available data: Calculate the mean, median, standard deviation, variance, and range for this sample using Excel. Write a sentence explaining what each measure means. What is the standard error of the mean based on the data? What would be the best point estimate for the population credit hours? (“Population” refers to all graduate students’ credit hours in the universe.) What...
Please explain how to Solve. Thank you 16. The following are interest rates (annual percentage rates)...
Please explain how to Solve. Thank you 16. The following are interest rates (annual percentage rates) for a 30-year-fixed-rate mortgage from a sample of lenders in a certain city. It is reasonable to assume that the population is approximately normal. 4.327, 4.461, 4.547, 4.813, 4.365, 4.772, 4.842. Find the upper bound of the 99% confidence interval for the mean rate. Round three decimal places. 4. A survey of high school students revealed that the number of soft drinks consumed per...
 Hw Score: 65.63%, 10.5 of 16 pts Score: 0 of 1 pt Question Help 6.4.17 Pulse Rates The pulse rates of a random sample of 16 adults are shown in the dot plot. Assume the sample is 90% confidence intervals for (a) the population variance σ2 and (b) the population standard deviation σ. Interpret the results. 60 65 70 75 80 85 L (Round to one decimal place as needed.) Enter your answer in the edit fields and then click...
 The rates of return on Cherry Jalopies, Inc., stock over the last five years were 19 percent, 11 percent, -1 percent, 3 percent, and 12 percent. Over the same period, the returns on Straw Construction Company's stock were 16 percent, 20 percent,-4 percent, 3 percent, and 20 percent. Calculate the variances and the standard deviations for Cherry and Straw. (Do not round intermediate calculations. Enter your variance as a decimal rounded to 5 decimal places. Enter your standard deviation as...
 1. Consider the following POPULATION of quiz scores {18, 23, 7,
20, 15, 12, 6, 23, 17, 16 }
Compute the following: the mean ,μ, the variance, σ2, the
standarddeviation, σ.
State the mode, if one exists __________
ApplytheEmpiricalRuleatthe95%level.
What percentage of these Quiz Scores actually lie within the
interval found in part c? _________________________
II. Again consider the given Quiz Scores: {18, 23, 7, 20, 15,
12, 6, 23, 17, 16 }
Determine Q1, the median, and Q3:
Draw...
1. Consider the following POPULATION of quiz scores {18, 23, 7,
20, 15, 12, 6, 23, 17, 16 }
Compute the following: the mean ,μ, the variance, σ2, the
standarddeviation, σ.
State the mode, if one exists __________
ApplytheEmpiricalRuleatthe95%level.
What percentage of these Quiz Scores actually lie within the
interval found in part c? _________________________
II. Again consider the given Quiz Scores: {18, 23, 7, 20, 15,
12, 6, 23, 17, 16 }
Determine Q1, the median, and Q3:
Draw...
 The rates of return on Cherry Jalopies, Inc., stock over the last five years were 12 percent, 11 percent, -3 percent, 2 percent, and 6 percent. Over the same period, the returns on Straw Construction Company's stock were 16 percent, 17 percent, -6 percent, 4 percent, and 9 percent Calculate the variances and the standard deviations for Cherry and Straw. (Do not round intermediate calculations. Enter your variance as a decimal rounded to 5 decimal places. Enter your standard deviation...
 Round to 4th decimal place, if needed A data set is as the following 8 1012 12 1214 14 141414 16 16 18 18 20 20 20 22 30 35 What is the mean? 2.What is the median? What is the variance, if this is a sample? What is the variance, if this is a population? Does it skew? (Right, Left, or Not) 5. A sample set is as the following with a missing value x110 12 12 12 1414...
 Determine the unit price rounded to the nearest cent. 5. $2.08 for 14 oz. Math 5. Determine whether this proportion is true or false. 5 3 6. Math =- 6. 22 13 Check Solve these proportions and check. 15 21 =- 7. Math 7. 14 Check 0.5 8. 11 8. Fm 22 Math Check Determine whether this proportion is true or false. 5 3 6. Math =- 6. 22 13 Check Solve these proportions and check. 15 21 =- 7....
Most questions answered within 3 hours.
-
Where is the error in this code sequence?
String s1 = "Hello";
String s2 = "ello";...
asked 11 months ago -
Financial data for Joel de Paris, Inc., for last year
follow:
Joel de Paris, Inc.
Balance...
asked 11 months ago -
Consider this reaction:
Al2(SO4)3 (aq)+ BaCl3
(aq) Al2Cl6 (aq)- +
3BaSO4(s) . What is the...
asked 11 months ago -
Suppose that Savneet is considering increasing her
recent random sample from 20 car rentals to 40...
asked 11 months ago -
Trucks arrive at an unloading terminal at an average rate of 120
per hour.
Trucks arrive...
asked 11 months ago -
Why are methanol and ethanol completely soluble in water while
octanol is not very little soluble....
asked 11 months ago -
A facilities manager at a university reads in a research report
that the mean amount of...
asked 11 months ago -
When the CuSO4 is rehydrated by adding water to the anhydrous
compound, is this an endothermic...
asked 11 months ago -
A ray of sunlight is passing from diamond into crown glass; the
angle of incidence is...
asked 11 months ago -
A block of mass 0.249 kg is placed on top of a light, vertical
spring of...
asked 11 months ago -
how do the kidneys compensate in the presences of acidosis
a) trigger hyperventilate
b) reserve acid...
asked 11 months ago -
Question 501 pts
The rental rate of capital to the firm increases. Which of the
following...
asked 11 months ago