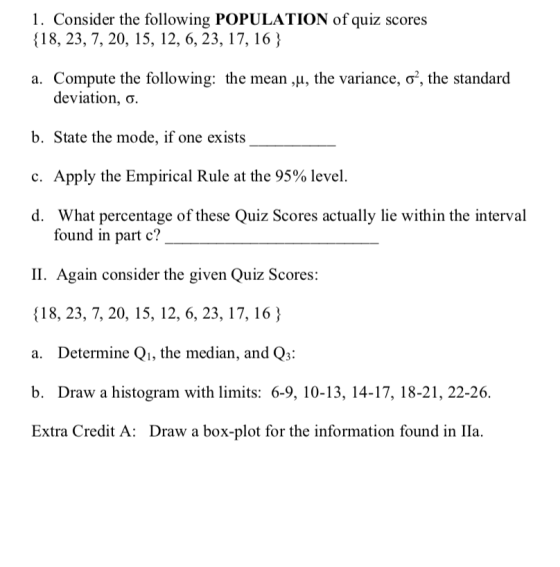
1. Consider the following POPULATION of quiz scores {18, 23, 7, 20, 15, 12, 6, 23, 17, 16 }
-
Compute the following: the mean ,μ, the variance, σ2, the standarddeviation, σ.
-
State the mode, if one exists __________
-
ApplytheEmpiricalRuleatthe95%level.
-
What percentage of these Quiz Scores actually lie within the interval found in part c? _________________________
II. Again consider the given Quiz Scores: {18, 23, 7, 20, 15, 12, 6, 23, 17, 16 }
-
Determine Q1, the median, and Q3:
-
Draw a histogram with limits: 6-9, 10-13, 14-17, 18-21, 22-26.
Extra Credit A: Draw a box-plot for the information found in IIa.
Homework Answers

Add Answer to:
1. Consider the following POPULATION of quiz scores {18, 23, 7,
20, 15, 12, 6, 23,...
1. The scores on a given test for ten students were as follows: 20, 15,...
1. The scores on a given test for ten students were as follows: 20, 15, 18, 38, 42, 51, 23, 26, 20, 11 Find the mean. Find the median. Find the mode. Find the midrange. Find Q1 Find P60 Find the percentile rank for the score 38. Find the range. 2. Find the sample variance of the test scores. (Show work by hand to receive credit!) 3. Construct a box plot using the test score data. 4. Construct a...
The following is data for the first and second Quiz scores for 8 students in a...
 The following is data for the first and second Quiz scores for 8 students in a class. First Quiz (Q1) Second Quiz (Q2) 17 15 18 14 19 15 20 19 26 24 27 23 29 28 30 27 Plot the points in the grid below, then sketch a line that best fits the data. 32+ Q2 28 24 20 16 12 8 Q1 8 12 16 20 24 28 33 Clear All Draw: : Use the line above to...
The following is data for the first and second Quiz scores for 8 students in a...
 The following is data for the first and second Quiz scores for 8 students in a class. First Quiz (Q1) 17 18 19 20 26 Second Quiz (Q2) 15 14 15 19 24 23 28 27 27 29 30 Plot the points in the grid below, then sketch a line that best fits the data. 32 Q2 28 24 20 16 12 8 4 Q1 28 32 8 12 16 20 24 Clear All Draw: Use the line above to...
The following is data for the first and second Quiz scores for 8 students in a...
 The following is data for the first and second Quiz scores for 8 students in a class. First Quiz (Q1) Second Quiz (Q2) 12 14 11 17 17 18 21 21 22 23 22 25 21 24 26 Plot the boints in the grid below, then sketch a line that best fits the data. 152+ Q2 28 24 20- 16- 12 84 4- QI 24 28 12 16 20 Clear All Draw: Use the line above to predict the value...
The following is data for the first and second Quiz scores for 8 students in a...
 The following is data for the first and second Quiz scores for 8 students in a class. First Quiz (Q1) Second Quiz (Q2) | 12 | 11 17 13 1917 2019 22 18 26 25 27 24 Plot the points in the grid below, then sketch a line that best fits the data. 01 4 8 12 16 20 24 28 32 Clear All Draw: / Avo . Use the line above to predict the value of the second quiz...
1. The scores on a given test for ten students were as follows: 20, 15,...
1. The scores on a given test for ten students were as follows: 20, 15, 18, 38, 42, 51, 23, 26, 20, 11 Find the mean. Find the median. Find the mode. Find the midrange. Find Q1 Find P60 Find the percentile rank for the score 38. Find the range. 2. Find the sample variance of the test scores. (Show work by hand to receive credit!) 3. Construct a box plot using the test score data. 4. Construct a...
Consider the following data. 14 21 23 20 16 19 22 26 15 16 23 25...
Consider the following data. 14 21 23 20 16 19 22 26 15 16 23 25 24 20 15 20 19 20 21 13 17 17 18 23 26 21 22 15 20 18 25 24 15 23 25 19 21 24 21 19 (a) Develop a frequency distribution using classes of 12–14, 15–17, 18–20, 21–23, and 24–26. Class Frequency 12–14 15–17 18–20 21–23 24–26 Total (b) Develop a relative frequency distribution and a percent frequency distribution using the classes...
Applied Managerial Statistics-WALL Martha Soto &1 a/17/18 4:06 PM Quiz: Week 3: MyStatLab Quiz Time Remaining:...
 Applied Managerial Statistics-WALL Martha Soto &1 a/17/18 4:06 PM Quiz: Week 3: MyStatLab Quiz Time Remaining: 01:16:58 Submit Quiz This Question: 2 pts 7 of 14 (5 complete) ▼ This Quiz: 60 pts possible Consider a frequency distribution of scores on a 50-point test where a few students scored much lower than the majority of students. Match this distribution with one of the graphs shown below 15 12 123 B D. 12 25000 95000 37.5 47.5 1 4 7 10...
Supplemental Study Assignment 4 (Chapters 17 & 18) 1. Given the following 20 scores in an...
Supplemental Study Assignment 4 (Chapters 17 & 18) 1. Given the following 20 scores in an attitude scale, complete the following exercise: 18 16 18 20 16 14 16 18 14 12 10 14 12 18 16 18 14 10 12 14 c. What is the median?
Consider the sample: 9, 6, 7, 9, 10, 8 a) Find : the mean, the median,...
Consider the sample: 9, 6, 7, 9, 10, 8 a) Find : the mean, the median, the mode b) Find : the range, the quartiles Q1, Q3, the variance, the standard deviation. c) Draw a box-plot for the given data set.
 The following is data for the first and second Quiz scores for 8 students in a class. First Quiz (Q1) Second Quiz (Q2) 17 15 18 14 19 15 20 19 26 24 27 23 29 28 30 27 Plot the points in the grid below, then sketch a line that best fits the data. 32+ Q2 28 24 20 16 12 8 Q1 8 12 16 20 24 28 33 Clear All Draw: : Use the line above to...
 The following is data for the first and second Quiz scores for 8 students in a class. First Quiz (Q1) 17 18 19 20 26 Second Quiz (Q2) 15 14 15 19 24 23 28 27 27 29 30 Plot the points in the grid below, then sketch a line that best fits the data. 32 Q2 28 24 20 16 12 8 4 Q1 28 32 8 12 16 20 24 Clear All Draw: Use the line above to...
 The following is data for the first and second Quiz scores for 8 students in a class. First Quiz (Q1) Second Quiz (Q2) 12 14 11 17 17 18 21 21 22 23 22 25 21 24 26 Plot the boints in the grid below, then sketch a line that best fits the data. 152+ Q2 28 24 20- 16- 12 84 4- QI 24 28 12 16 20 Clear All Draw: Use the line above to predict the value...
 The following is data for the first and second Quiz scores for 8 students in a class. First Quiz (Q1) Second Quiz (Q2) | 12 | 11 17 13 1917 2019 22 18 26 25 27 24 Plot the points in the grid below, then sketch a line that best fits the data. 01 4 8 12 16 20 24 28 32 Clear All Draw: / Avo . Use the line above to predict the value of the second quiz...
 Applied Managerial Statistics-WALL Martha Soto &1 a/17/18 4:06 PM Quiz: Week 3: MyStatLab Quiz Time Remaining: 01:16:58 Submit Quiz This Question: 2 pts 7 of 14 (5 complete) ▼ This Quiz: 60 pts possible Consider a frequency distribution of scores on a 50-point test where a few students scored much lower than the majority of students. Match this distribution with one of the graphs shown below 15 12 123 B D. 12 25000 95000 37.5 47.5 1 4 7 10...
Most questions answered within 3 hours.
-
Where is the error in this code sequence?
String s1 = "Hello";
String s2 = "ello";...
asked 11 months ago -
Financial data for Joel de Paris, Inc., for last year
follow:
Joel de Paris, Inc.
Balance...
asked 11 months ago -
Consider this reaction:
Al2(SO4)3 (aq)+ BaCl3
(aq) Al2Cl6 (aq)- +
3BaSO4(s) . What is the...
asked 11 months ago -
Suppose that Savneet is considering increasing her
recent random sample from 20 car rentals to 40...
asked 11 months ago -
Trucks arrive at an unloading terminal at an average rate of 120
per hour.
Trucks arrive...
asked 11 months ago -
Why are methanol and ethanol completely soluble in water while
octanol is not very little soluble....
asked 11 months ago -
A facilities manager at a university reads in a research report
that the mean amount of...
asked 11 months ago -
When the CuSO4 is rehydrated by adding water to the anhydrous
compound, is this an endothermic...
asked 11 months ago -
A ray of sunlight is passing from diamond into crown glass; the
angle of incidence is...
asked 11 months ago -
A block of mass 0.249 kg is placed on top of a light, vertical
spring of...
asked 11 months ago -
how do the kidneys compensate in the presences of acidosis
a) trigger hyperventilate
b) reserve acid...
asked 11 months ago -
Question 501 pts
The rental rate of capital to the firm increases. Which of the
following...
asked 11 months ago