

please do the new one with all the 2 steps, completed one shows both the steps it asks for
Homework Answers


Add Answer to:
please do the new one with all the 2 steps, completed one shows
both the steps...
Homework: HW 14 - Chapter 14 Score: 0 of 1 pt 4.2.77 The following tables gives...
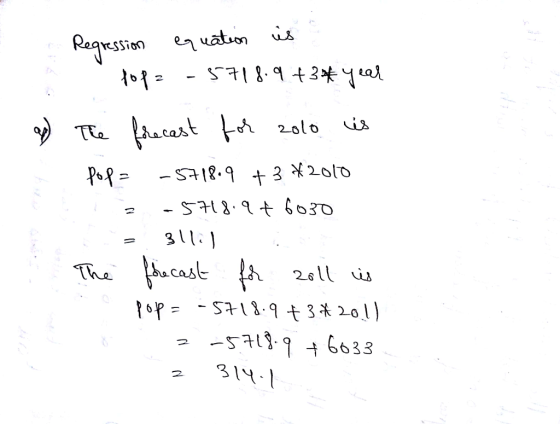
 Homework: HW 14 - Chapter 14 Score: 0 of 1 pt 4.2.77 The following tables gives the population for a country, in milions of persons, for the years 1990-2009. Forecast the population in the years 2010 and 2011. Save 11 of 13 (10 complete) HW Score: 74.36%, 9.67 of 13 pts Question Help * Year 1990 1991 | 1992 | 1993 1994 |1995 | 1996 | 1997 1998 1999 Pop T 250 T 253 257T260 T 263 266 269 T...
Using the Consumer Price Index (CPI) detailed in the table below, Year CPI CPI Year 2003...
 Using the Consumer Price Index (CPI) detailed in the table below, Year CPI CPI Year 2003 1989 1990 1991 1992 1993 1994 1995 124.0 130.7 136.2 140.3 144.5 148.2 152.4 156.9 160.5 163.0 2004 2005 2006 2007 2008 2009 2010 184.0 188.9 195.3 201.6 207.3 215.3 214.5 218.1 224.9 229.6 233.0 236.7 237.0 240.0 1996 1997 1998 1999 2000 2011 2012 2013 2014 166.6 172.2 177.1 179.7 2001 2002 2015 2016 Instructions: Enter your responses rounded to one decimal place...
According to the data below, which market is larger in value? New Stock Issued Trading Volume...
According to the data below, which market is larger in value? New Stock Issued Trading Volume of Existing Stock 1990 $ 23.90 $ 1,750.00 1991 $ 75.90 $ 2,175.00 1992 $ 101.80 $ 2,600.00 1993 $ 130.80 $ 3,575.00 1994 $ 76.90 $ 3,875.00 1995 $ 97.10 $ 5,425.00 1996 $ 151.90 $ 7,250.00 1997 $ 153.40 $ 10,125.00 1998 $ 152.70 $ 12,975.00 1999 $ 191.70 $ 19,800.00 2000 $ 204.50 $ 31,200.00 2001 $ 169.70 $ 21,600.00 2002...
The data set on the right contains the real per capita GDP for 2 countries from the Penn World Table (PWT) version 9.1 (Feenstra et al., 2015). The column names are the country codes, OMN and PSE. You may copy the dataset to Excel or R to do the computati
 YearOMN197011266197176221972632319735051197473381975802219768360197793611978965919791092719801149919811280319821276619831242319841306419851403219861019219871005419888809198992381990105911991991819921026319931004519949747199510199199611054199711784199811560199913501200016173200116853200218508200320329200425768200526647200638458200740960200847136200938538201040305201144477201247334201344979201440855201532460201629939201728249
Falloing the spreadsheet calculates the average return and standard deviation for both Boeing and Bank of...
 Falloing the spreadsheet
calculates the average return and standard deviation for both
Boeing and Bank of America.
1991 Bank of America 1142 -118 505 13.7 1992 1993 138 1995 72.7 1996 53.2 321 1997 1998 1999 32.5 28.7 2000 2001 2002 61.2 40.4 13.4 30.4 45.6 18.9 2003 246 2004 25.3 37.9 2005 2006 2007 23.4 20.7 2008 -63.4 2009 2010 2011 2012 -50.1 31.8 23.6 15.2 5.2 84.2 -112 -58.1 34,6 155
Falloing the spreadsheet
calculates the average return and standard deviation for both
Boeing and Bank of America.
1991 Bank of America 1142 -118 505 13.7 1992 1993 138 1995 72.7 1996 53.2 321 1997 1998 1999 32.5 28.7 2000 2001 2002 61.2 40.4 13.4 30.4 45.6 18.9 2003 246 2004 25.3 37.9 2005 2006 2007 23.4 20.7 2008 -63.4 2009 2010 2011 2012 -50.1 31.8 23.6 15.2 5.2 84.2 -112 -58.1 34,6 155
The general fund budget for a state for 1988 (Period 1) to 2011 (Period 24) follows....
 The general fund budget for a state for 1988 (Period 1) to 2011 (Period 24) follows. vau AWN Year Period Budget ($billions) 1988 1 3.05 1989 3.29 1990 3 3.56 1991 4.31 1992 4.39 1993 4.54 1994 4.66 1995 5.19 1996 5.35 1997 5.69 1998 6.01 1999 12 2000 6.48 2001 6.65 2002 15 6.56 2003 6.78 2004 6.98 2005 18 2006 8.38 2007 8.57 2008 21 8.66 2009 8.43 2010 23 8.23 2011 24 8.76 6.2 7.65 a. Which...
A line chart of these data would provide what type of illustration of US stock values?...
A line chart of these data would provide what type of illustration of US stock values? New Stock Issued Trading Volume of Existing Stock 1990 $23.90 $1,750.00 1991 $75.90 $2,175.00 1992 $101.80 $2,600.00 1993 $130.80 $3,575.00 1994 $76.90 $3,875.00 1995 $97.10 $5,425.00 1996 $151.90 $7,250.00 1997 $153.40 $10,125.00 1998 $152.70 $12,975.00 1999 $191.70 $19,800.00 2000 $204.50 $31,200.00 2001 $169.70 $21,600.00 2002 $154.00 $17,425.00 2003 $156.30 $16,625.00 2004 $202.70 $20,175.00 2005 $190.40 $23,900.00 2006 $190.50 $28,700.00 2007 $247.50 $36,700.00 2008 $242.61...
7. Study the table below and identify the following: a. years in which the economy expanded...
 7. Study the table below and identify the following: a. years in which the economy expanded b. years in which the economy contracted c. peaks d. troughs Year 1998 Annual Percentage Change in Real GDP (2007 $) -3.1 2.6 5.7 5.2 2.8 4.6 Year 1982 1983 1984 1985 1986 1987 1988 1989 1990 1991 1992 1993 1994 1995 1996 1997 Annual Percentage Change in Real GDP (2007 $) 4.1 5.4 5.4 1.4 2.7 2.0 3.1 3.2 2.4 2.2 1.1 -2.9...
Which column describes the Secondary Market (as this term is used in Chapter 1) for US...
Which column describes the Secondary Market (as this term is used in Chapter 1) for US stock? New Stock Issued Trading Volume of Existing Stock 1990 $23.90 $1,750.00 1991 $75.90 $2,175.00 1992 $101.80 $2,600.00 1993 $130.80 $3,575.00 1994 $76.90 $3,875.00 1995 $97.10 $5,425.00 1996 $151.90 $7,250.00 1997 $153.40 $10,125.00 1998 $152.70 $12,975.00 1999 $191.70 $19,800.00 2000 $204.50 $31,200.00 2001 $169.70 $21,600.00 2002 $154.00 $17,425.00 2003 $156.30 $16,625.00 2004 $202.70 $20,175.00 2005 $190.40 $23,900.00 2006 $190.50 $28,700.00 2007 $247.50 $36,700.00 2008...
 Homework: HW 14 - Chapter 14 Score: 0 of 1 pt 4.2.77 The following tables gives the population for a country, in milions of persons, for the years 1990-2009. Forecast the population in the years 2010 and 2011. Save 11 of 13 (10 complete) HW Score: 74.36%, 9.67 of 13 pts Question Help * Year 1990 1991 | 1992 | 1993 1994 |1995 | 1996 | 1997 1998 1999 Pop T 250 T 253 257T260 T 263 266 269 T...
 Using the Consumer Price Index (CPI) detailed in the table below, Year CPI CPI Year 2003 1989 1990 1991 1992 1993 1994 1995 124.0 130.7 136.2 140.3 144.5 148.2 152.4 156.9 160.5 163.0 2004 2005 2006 2007 2008 2009 2010 184.0 188.9 195.3 201.6 207.3 215.3 214.5 218.1 224.9 229.6 233.0 236.7 237.0 240.0 1996 1997 1998 1999 2000 2011 2012 2013 2014 166.6 172.2 177.1 179.7 2001 2002 2015 2016 Instructions: Enter your responses rounded to one decimal place...
 Falloing the spreadsheet
calculates the average return and standard deviation for both
Boeing and Bank of America.
1991 Bank of America 1142 -118 505 13.7 1992 1993 138 1995 72.7 1996 53.2 321 1997 1998 1999 32.5 28.7 2000 2001 2002 61.2 40.4 13.4 30.4 45.6 18.9 2003 246 2004 25.3 37.9 2005 2006 2007 23.4 20.7 2008 -63.4 2009 2010 2011 2012 -50.1 31.8 23.6 15.2 5.2 84.2 -112 -58.1 34,6 155
Falloing the spreadsheet
calculates the average return and standard deviation for both
Boeing and Bank of America.
1991 Bank of America 1142 -118 505 13.7 1992 1993 138 1995 72.7 1996 53.2 321 1997 1998 1999 32.5 28.7 2000 2001 2002 61.2 40.4 13.4 30.4 45.6 18.9 2003 246 2004 25.3 37.9 2005 2006 2007 23.4 20.7 2008 -63.4 2009 2010 2011 2012 -50.1 31.8 23.6 15.2 5.2 84.2 -112 -58.1 34,6 155
 The general fund budget for a state for 1988 (Period 1) to 2011 (Period 24) follows. vau AWN Year Period Budget ($billions) 1988 1 3.05 1989 3.29 1990 3 3.56 1991 4.31 1992 4.39 1993 4.54 1994 4.66 1995 5.19 1996 5.35 1997 5.69 1998 6.01 1999 12 2000 6.48 2001 6.65 2002 15 6.56 2003 6.78 2004 6.98 2005 18 2006 8.38 2007 8.57 2008 21 8.66 2009 8.43 2010 23 8.23 2011 24 8.76 6.2 7.65 a. Which...
 7. Study the table below and identify the following: a. years in which the economy expanded b. years in which the economy contracted c. peaks d. troughs Year 1998 Annual Percentage Change in Real GDP (2007 $) -3.1 2.6 5.7 5.2 2.8 4.6 Year 1982 1983 1984 1985 1986 1987 1988 1989 1990 1991 1992 1993 1994 1995 1996 1997 Annual Percentage Change in Real GDP (2007 $) 4.1 5.4 5.4 1.4 2.7 2.0 3.1 3.2 2.4 2.2 1.1 -2.9...
Most questions answered within 3 hours.
-
Where is the error in this code sequence?
String s1 = "Hello";
String s2 = "ello";...
asked 11 months ago -
Financial data for Joel de Paris, Inc., for last year
follow:
Joel de Paris, Inc.
Balance...
asked 11 months ago -
Consider this reaction:
Al2(SO4)3 (aq)+ BaCl3
(aq) Al2Cl6 (aq)- +
3BaSO4(s) . What is the...
asked 11 months ago -
Suppose that Savneet is considering increasing her
recent random sample from 20 car rentals to 40...
asked 11 months ago -
Trucks arrive at an unloading terminal at an average rate of 120
per hour.
Trucks arrive...
asked 11 months ago -
Why are methanol and ethanol completely soluble in water while
octanol is not very little soluble....
asked 11 months ago -
A facilities manager at a university reads in a research report
that the mean amount of...
asked 11 months ago -
When the CuSO4 is rehydrated by adding water to the anhydrous
compound, is this an endothermic...
asked 11 months ago -
A ray of sunlight is passing from diamond into crown glass; the
angle of incidence is...
asked 11 months ago -
A block of mass 0.249 kg is placed on top of a light, vertical
spring of...
asked 11 months ago -
how do the kidneys compensate in the presences of acidosis
a) trigger hyperventilate
b) reserve acid...
asked 11 months ago -
Question 501 pts
The rental rate of capital to the firm increases. Which of the
following...
asked 11 months ago