Simon Company’s year-end balance sheets follow.
| At December 31 | 2017 | 2016 | 2015 | ||||||
| Assets | |||||||||
| Cash | $ | 36,335 | $ | 42,472 | $ | 42,524 | |||
| Accounts receivable, net | 107,459 | 73,568 | 56,120 | ||||||
| Merchandise inventory | 139,163 | 102,226 | 60,994 | ||||||
| Prepaid expenses | 12,179 | 11,377 | 4,773 | ||||||
| Plant assets, net |
333,281 |
312,096 | 273,889 | ||||||
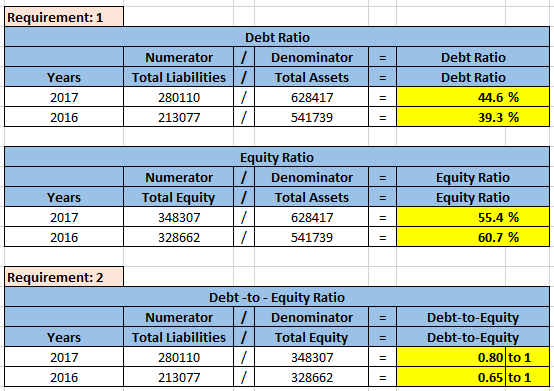
| Total assets | $ | 628,417 | $ | 541,739 | $ | 438,300 | |||
| Liabilities and Equity | |||||||||
| Accounts payable | $ | 159,605 | $ | 89,723 | $ | 59,013 | |||
| Long-term notes payable secured by mortgages on plant assets |
120,505 | 123,354 | 94,927 | ||||||
| Common stock, $10 par value | 162,500 | 162,500 | 162,500 | ||||||
| Retained earnings | 185,807 | 166,162 | 121,860 | ||||||
| Total liabilities and equity | $ | 628,417 | $ | 541,739 | $ | 438,300 | |||
The company’s income statements for the years ended December 31,
2017 and 2016, follow.
| For Year Ended December 31 | 2017 | 2016 | ||||||||||
| Sales | $ | 816,942 | $ | 644,669 | ||||||||
| Cost of goods sold | $ | 498,335 | $ | 419,035 | ||||||||
| Other operating expenses | 253,252 | 163,101 | ||||||||||
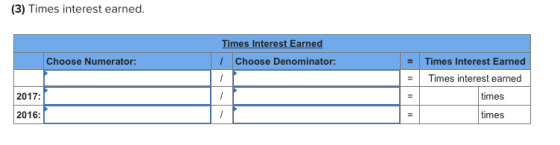
| Interest expense | 13,888 | 14,827 | ||||||||||
| Income taxes | 10,620 | 9,670 | ||||||||||
| Total costs and expenses | 776,095 | 606,633 | ||||||||||
| Net income | $ | 40,847 | $ | 38,036 | ||||||||
| Earnings per share | $ | 2.51 | $ | 2.34 | ||||||||
Calculate the company’s long-term risk and capital structure
positions at the end of 2017 and 2016 by computing the following
ratios.

Homework Answers

Add Answer to:
Simon Company’s year-end balance sheets follow.
At December 31
2017
2016
2015
Assets
Cash
$
36,335...
Simon Company’s year-end balance sheets follow. At December 31 2017 2016 2015 Assets Cash $ 27,904 $ 32...
 Simon Company’s year-end balance sheets follow.
At December 31
2017
2016
2015
Assets
Cash
$
27,904
$
32,617
$
34,676
Accounts receivable, net
89,700
62,600
59,700
Merchandise inventory
113,000
83,000
54,000
Prepaid expenses
8,986
8,562
3,853
Plant assets, net
247,981
233,541
208,871
Total assets
$
487,571
$
420,320
$
361,100
Liabilities and Equity
Accounts payable
$
117,763
$
68,903
$
46,235
Long-term notes payable secured by
mortgages on plant assets
88,913
93,773
77,409
Common stock, $10 par value
162,500
162,500...
Simon Company’s year-end balance sheets follow.
At December 31
2017
2016
2015
Assets
Cash
$
27,904
$
32,617
$
34,676
Accounts receivable, net
89,700
62,600
59,700
Merchandise inventory
113,000
83,000
54,000
Prepaid expenses
8,986
8,562
3,853
Plant assets, net
247,981
233,541
208,871
Total assets
$
487,571
$
420,320
$
361,100
Liabilities and Equity
Accounts payable
$
117,763
$
68,903
$
46,235
Long-term notes payable secured by
mortgages on plant assets
88,913
93,773
77,409
Common stock, $10 par value
162,500
162,500...
Simon Company’s year-end balance sheets follow. At December 31 2017 2016 2015 Assets Cash $ 31,800...
 Simon Company’s year-end balance sheets follow.
At December 31
2017
2016
2015
Assets
Cash
$
31,800
$
36,000
$
37,200
Accounts receivable, net
88,100
62,000
50,500
Merchandise inventory
111,000
83,800
54,500
Prepaid expenses
10,300
9,350
4,600
Plant assets, net
280,000
257,000
235,000
Total assets
$
521,200
$
448,150
$
381,800
Liabilities and Equity
Accounts payable
$
129,200
$
75,250
$
50,400
Long-term notes payable secured by
mortgages on plant assets
98,000
100,000
82,600
Common stock, $10 par value
161,500
161,500...
Simon Company’s year-end balance sheets follow.
At December 31
2017
2016
2015
Assets
Cash
$
31,800
$
36,000
$
37,200
Accounts receivable, net
88,100
62,000
50,500
Merchandise inventory
111,000
83,800
54,500
Prepaid expenses
10,300
9,350
4,600
Plant assets, net
280,000
257,000
235,000
Total assets
$
521,200
$
448,150
$
381,800
Liabilities and Equity
Accounts payable
$
129,200
$
75,250
$
50,400
Long-term notes payable secured by
mortgages on plant assets
98,000
100,000
82,600
Common stock, $10 par value
161,500
161,500...
At December 31 2017 2016 2015 Assets Cash $ 33,338 $ 40,138 $38,236 Accounts receivable, net...
 At December 31 2017 2016 2015 Assets Cash $ 33,338 $ 40,138 $38,236 Accounts receivable, net Merchandise inventory Prepaid expenses Plant assets, net 93,724 125,129 10,521 68,195 91,016 10,127 277,632 53,582 55,403 4,422 242,457 $565,045 $487,108 394,100 302,333 Total assets Liabilities and Equity Accounts payable Long-term notes payable secured by mortgages on plant assets Common stock, $10 par value Retained earnings $140,696 $ 82,321 50,461 112,035 162,500 130,252 $565,045 $487,108 394,100 109,415 162,500 152,434 85,354 162,500 95,785 Total liabilities and...
Simon Company’s year-end balance sheets follow. At December 31 2017 2016 2015 Assets Cash $ 35,286...
 Simon Company’s year-end balance sheets follow.
At December 31
2017
2016
2015
Assets
Cash
$
35,286
$
41,246
$
40,887
Accounts receivable, net
101,276
68,676
54,516
Merchandise inventory
124,839
95,381
58,060
Prepaid expenses
11,143
10,407
4,634
Plant assets, net
308,101
284,846
254,903
Total assets
$
580,645
$
500,556
$
413,000
Liabilities and
Equity
Accounts payable
$
143,135
$
86,286
$
55,606
Long-term notes payable secured
by
mortgages on plant assets
111,344
117,430
93,098
Common stock, $10 par value
162,500
162,500...
Simon Company’s year-end balance sheets follow.
At December 31
2017
2016
2015
Assets
Cash
$
35,286
$
41,246
$
40,887
Accounts receivable, net
101,276
68,676
54,516
Merchandise inventory
124,839
95,381
58,060
Prepaid expenses
11,143
10,407
4,634
Plant assets, net
308,101
284,846
254,903
Total assets
$
580,645
$
500,556
$
413,000
Liabilities and
Equity
Accounts payable
$
143,135
$
86,286
$
55,606
Long-term notes payable secured
by
mortgages on plant assets
111,344
117,430
93,098
Common stock, $10 par value
162,500
162,500...
Simon Company’s year-end balance sheets follow. At December 31 2017 2016 2015 Assets Cash $ 35,662...
Simon Company’s year-end balance sheets follow. At December 31 2017 2016 2015 Assets Cash $ 35,662 $ 42,962 $ 44,296 Accounts receivable, net 107,579 75,183 56,767 Merchandise inventory 131,281 97,382 62,302 Prepaid expenses 11,484 11,054 4,731 Plant assets, net 330,773 305,125 266,304 Total assets $ 616,779 $ 531,706 $ 434,400 Liabilities and Equity Accounts payable $ 153,578 $ 90,757 $ 56,194 Long-term notes payable secured by mortgages on plant assets 118,274 124,738 97,922 Common stock, $10 par value 162,500 162,500...
[The following information applies to the questions displayed below.) Simon Company's year-end balance sheets follow. 2017...
 [The following information applies to the questions displayed below.) Simon Company's year-end balance sheets follow. 2017 2016 2015 At December 31 Assets Cash Accounts receivable, net Merchandise inventory Prepaid expenses Plant assets, net Total assets Liabilities and Equity Accounts payable Long-term notes payable secured by mortgages on plant assets Common stock, $10 par value Retained earnings Total liabilities and equity $ 29,378 $ 34, 341 $ 33,678 84,296 60,096 46,292 104,916 78,618 48,305 9,366 9,195 3,781 269,982 247,007 218,644 $497,938...
The following information applies to the questions displayed below) Simon Company's year-end balance sheets follow. 2017...
 The following information applies to the questions displayed below) Simon Company's year-end balance sheets follow. 2017 2016 2015 At December 31 Assets Cash Accounts receivable, net Merchandise inventory Prepaid expenses plant assets, net Total assets Liabilities and Equity Accounts payable Long-term notes payable secured by mortgages on plant assets Common stock, $10 par value Retained earnings Total liabilities and equity $ 37,295 $ 42,739 $ 43,634 107,031 77,037 57,003 130,575 98,834 62,586 12,21% 11,107 4,750 332,807 304,523 277,227 $619,718 $534,240...
Simon Company's year-end balance sheets follow. 2017 2016 2015 At Assets Cash Accounts receivable, net Merchandise...
 Simon Company's year-end balance sheets follow. 2017 2016 2015 At Assets Cash Accounts receivable, net Merchandise inventory Prepaid expenses Plant assets, net Total assets 31,178 $ 36,444 37,211 89,469 65,041 49,128 111,365 85,112 52,327 4,013 281,159 254, 691 225, 821 $523,211 $451,044 $ 368, 500 10,040 9,756 Liabilities and Equity Accounts payable Long-term notes payable secured by $127,674 78,513 $ 50,101 mortgages on plant assets Common stock, $10 par value Retained earnings Total liabilities and equity 95,413 101,665 83,882 162,500...
Simon Company’s year-end balance sheets follow. At December 31 Current Yr 1 Yr Ago 2 Yrs...
Simon Company’s year-end balance sheets follow. At December 31 Current Yr 1 Yr Ago 2 Yrs Ago Assets Cash $ 30,277 $ 35,738 $ 35,416 Accounts receivable, net 87,751 58,898 49,655 Merchandise inventory 107,085 81,841 52,370 Prepaid expenses 9,655 9,108 4,097 Plant assets, net 268,334 248,124 227,262 Total assets $ 503,102 $ 433,709 $ 368,800 Liabilities and Equity Accounts payable $ 127,778 $ 73,297 $ 48,195 Long-term notes payable secured by mortgages on plant assets 93,637 101,748 82,320 Common stock,...
Simon Company’s year-end balance sheets follow. At December 31 Current Yr 1 Yr Ago 2 Yrs...
Simon Company’s year-end balance sheets follow. At December 31 Current Yr 1 Yr Ago 2 Yrs Ago Assets Cash $ 32,294 $ 38,893 $ 38,527 Accounts receivable, net 93,598 67,395 53,488 Merchandise inventory 117,682 87,294 55,831 Prepaid expenses 10,295 10,009 4,369 Plant assets, net 299,017 273,035 248,985 Total assets $ 552,886 $ 476,626 $ 401,200 Liabilities and Equity Accounts payable $ 136,292 $ 78,133 $ 51,899 Long-term notes payable secured by mortgages on plant assets 100,824 107,432 87,779 Common stock,...
 Simon Company’s year-end balance sheets follow.
At December 31
2017
2016
2015
Assets
Cash
$
27,904
$
32,617
$
34,676
Accounts receivable, net
89,700
62,600
59,700
Merchandise inventory
113,000
83,000
54,000
Prepaid expenses
8,986
8,562
3,853
Plant assets, net
247,981
233,541
208,871
Total assets
$
487,571
$
420,320
$
361,100
Liabilities and Equity
Accounts payable
$
117,763
$
68,903
$
46,235
Long-term notes payable secured by
mortgages on plant assets
88,913
93,773
77,409
Common stock, $10 par value
162,500
162,500...
Simon Company’s year-end balance sheets follow.
At December 31
2017
2016
2015
Assets
Cash
$
27,904
$
32,617
$
34,676
Accounts receivable, net
89,700
62,600
59,700
Merchandise inventory
113,000
83,000
54,000
Prepaid expenses
8,986
8,562
3,853
Plant assets, net
247,981
233,541
208,871
Total assets
$
487,571
$
420,320
$
361,100
Liabilities and Equity
Accounts payable
$
117,763
$
68,903
$
46,235
Long-term notes payable secured by
mortgages on plant assets
88,913
93,773
77,409
Common stock, $10 par value
162,500
162,500...
 Simon Company’s year-end balance sheets follow.
At December 31
2017
2016
2015
Assets
Cash
$
31,800
$
36,000
$
37,200
Accounts receivable, net
88,100
62,000
50,500
Merchandise inventory
111,000
83,800
54,500
Prepaid expenses
10,300
9,350
4,600
Plant assets, net
280,000
257,000
235,000
Total assets
$
521,200
$
448,150
$
381,800
Liabilities and Equity
Accounts payable
$
129,200
$
75,250
$
50,400
Long-term notes payable secured by
mortgages on plant assets
98,000
100,000
82,600
Common stock, $10 par value
161,500
161,500...
Simon Company’s year-end balance sheets follow.
At December 31
2017
2016
2015
Assets
Cash
$
31,800
$
36,000
$
37,200
Accounts receivable, net
88,100
62,000
50,500
Merchandise inventory
111,000
83,800
54,500
Prepaid expenses
10,300
9,350
4,600
Plant assets, net
280,000
257,000
235,000
Total assets
$
521,200
$
448,150
$
381,800
Liabilities and Equity
Accounts payable
$
129,200
$
75,250
$
50,400
Long-term notes payable secured by
mortgages on plant assets
98,000
100,000
82,600
Common stock, $10 par value
161,500
161,500...
 At December 31 2017 2016 2015 Assets Cash $ 33,338 $ 40,138 $38,236 Accounts receivable, net Merchandise inventory Prepaid expenses Plant assets, net 93,724 125,129 10,521 68,195 91,016 10,127 277,632 53,582 55,403 4,422 242,457 $565,045 $487,108 394,100 302,333 Total assets Liabilities and Equity Accounts payable Long-term notes payable secured by mortgages on plant assets Common stock, $10 par value Retained earnings $140,696 $ 82,321 50,461 112,035 162,500 130,252 $565,045 $487,108 394,100 109,415 162,500 152,434 85,354 162,500 95,785 Total liabilities and...
 Simon Company’s year-end balance sheets follow.
At December 31
2017
2016
2015
Assets
Cash
$
35,286
$
41,246
$
40,887
Accounts receivable, net
101,276
68,676
54,516
Merchandise inventory
124,839
95,381
58,060
Prepaid expenses
11,143
10,407
4,634
Plant assets, net
308,101
284,846
254,903
Total assets
$
580,645
$
500,556
$
413,000
Liabilities and
Equity
Accounts payable
$
143,135
$
86,286
$
55,606
Long-term notes payable secured
by
mortgages on plant assets
111,344
117,430
93,098
Common stock, $10 par value
162,500
162,500...
Simon Company’s year-end balance sheets follow.
At December 31
2017
2016
2015
Assets
Cash
$
35,286
$
41,246
$
40,887
Accounts receivable, net
101,276
68,676
54,516
Merchandise inventory
124,839
95,381
58,060
Prepaid expenses
11,143
10,407
4,634
Plant assets, net
308,101
284,846
254,903
Total assets
$
580,645
$
500,556
$
413,000
Liabilities and
Equity
Accounts payable
$
143,135
$
86,286
$
55,606
Long-term notes payable secured
by
mortgages on plant assets
111,344
117,430
93,098
Common stock, $10 par value
162,500
162,500...
 [The following information applies to the questions displayed below.) Simon Company's year-end balance sheets follow. 2017 2016 2015 At December 31 Assets Cash Accounts receivable, net Merchandise inventory Prepaid expenses Plant assets, net Total assets Liabilities and Equity Accounts payable Long-term notes payable secured by mortgages on plant assets Common stock, $10 par value Retained earnings Total liabilities and equity $ 29,378 $ 34, 341 $ 33,678 84,296 60,096 46,292 104,916 78,618 48,305 9,366 9,195 3,781 269,982 247,007 218,644 $497,938...
 The following information applies to the questions displayed below) Simon Company's year-end balance sheets follow. 2017 2016 2015 At December 31 Assets Cash Accounts receivable, net Merchandise inventory Prepaid expenses plant assets, net Total assets Liabilities and Equity Accounts payable Long-term notes payable secured by mortgages on plant assets Common stock, $10 par value Retained earnings Total liabilities and equity $ 37,295 $ 42,739 $ 43,634 107,031 77,037 57,003 130,575 98,834 62,586 12,21% 11,107 4,750 332,807 304,523 277,227 $619,718 $534,240...
 Simon Company's year-end balance sheets follow. 2017 2016 2015 At Assets Cash Accounts receivable, net Merchandise inventory Prepaid expenses Plant assets, net Total assets 31,178 $ 36,444 37,211 89,469 65,041 49,128 111,365 85,112 52,327 4,013 281,159 254, 691 225, 821 $523,211 $451,044 $ 368, 500 10,040 9,756 Liabilities and Equity Accounts payable Long-term notes payable secured by $127,674 78,513 $ 50,101 mortgages on plant assets Common stock, $10 par value Retained earnings Total liabilities and equity 95,413 101,665 83,882 162,500...
Most questions answered within 3 hours.
-
Where is the error in this code sequence?
String s1 = "Hello";
String s2 = "ello";...
asked 10 months ago -
Financial data for Joel de Paris, Inc., for last year
follow:
Joel de Paris, Inc.
Balance...
asked 10 months ago -
Consider this reaction:
Al2(SO4)3 (aq)+ BaCl3
(aq) Al2Cl6 (aq)- +
3BaSO4(s) . What is the...
asked 10 months ago -
Suppose that Savneet is considering increasing her
recent random sample from 20 car rentals to 40...
asked 10 months ago -
Trucks arrive at an unloading terminal at an average rate of 120
per hour.
Trucks arrive...
asked 10 months ago -
Why are methanol and ethanol completely soluble in water while
octanol is not very little soluble....
asked 10 months ago -
A facilities manager at a university reads in a research report
that the mean amount of...
asked 10 months ago -
When the CuSO4 is rehydrated by adding water to the anhydrous
compound, is this an endothermic...
asked 10 months ago -
A ray of sunlight is passing from diamond into crown glass; the
angle of incidence is...
asked 10 months ago -
A block of mass 0.249 kg is placed on top of a light, vertical
spring of...
asked 10 months ago -
how do the kidneys compensate in the presences of acidosis
a) trigger hyperventilate
b) reserve acid...
asked 10 months ago -
Question 501 pts
The rental rate of capital to the firm increases. Which of the
following...
asked 10 months ago