Simon Company’s year-end balance sheets follow. At December 31 2017 2016 2015 Assets Cash $ 35,662...
Simon Company’s year-end balance sheets follow.
| At December 31 | 2017 | 2016 | 2015 | ||||||
| Assets | |||||||||
| Cash | $ | 35,662 | $ | 42,962 | $ | 44,296 | |||
| Accounts receivable, net | 107,579 | 75,183 | 56,767 | ||||||
| Merchandise inventory | 131,281 | 97,382 | 62,302 | ||||||
| Prepaid expenses | 11,484 | 11,054 | 4,731 | ||||||
| Plant assets, net |
330,773 |
305,125 | 266,304 | ||||||
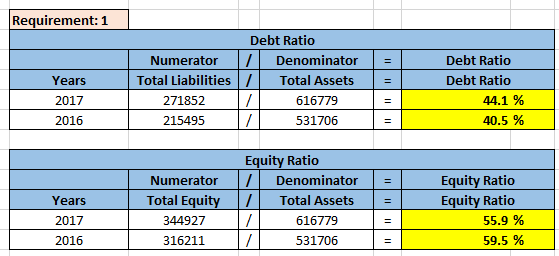
| Total assets | $ | 616,779 | $ | 531,706 | $ | 434,400 | |||
| Liabilities and Equity | |||||||||
| Accounts payable | $ | 153,578 | $ | 90,757 | $ | 56,194 | |||
| Long-term notes payable secured by mortgages on plant assets |
118,274 | 124,738 | 97,922 | ||||||
| Common stock, $10 par value | 162,500 | 162,500 | 162,500 | ||||||
| Retained earnings | 182,427 | 153,711 | 117,784 | ||||||
| Total liabilities and equity | $ | 616,779 | $ | 531,706 | $ | 434,400 | |||
The company’s income statements for the years ended December 31,
2017 and 2016, follow.
| For Year Ended December 31 | 2017 | 2016 | ||||||||||
| Sales | $ | 801,813 | $ | 632,730 | ||||||||
| Cost of goods sold | $ | 489,106 | $ | 411,275 | ||||||||
| Other operating expenses | 248,562 | 160,081 | ||||||||||
| Interest expense | 13,631 | 14,553 | ||||||||||
| Income taxes | 10,424 | 9,491 | ||||||||||
| Total costs and expenses | 761,723 | 595,400 | ||||||||||
| Net income | $ | 40,090 | $ | 37,330 | ||||||||
| Earnings per share | $ | 2.47 | $ | 2.30 | ||||||||
Calculate the company’s long-term risk and capital structure
positions at the end of 2017 and 2016 by computing the following
ratios.
(1) Debt and equity ratios.
Check my workCheck My Work button is now enabled2
Item 6
Item 6 Part 2 of 3 1.35 points Item Skipped
Time Remaining 2 hours 23 minutes 1 second
02:23:01
Required information
[The following information applies to the questions
displayed below.]
Simon Company’s year-end balance sheets follow.
| At December 31 | 2017 | 2016 | 2015 | ||||||
| Assets | |||||||||
| Cash | $ | 35,662 | $ | 42,962 | $ | 44,296 | |||
| Accounts receivable, net | 107,579 | 75,183 | 56,767 | ||||||
| Merchandise inventory | 131,281 | 97,382 | 62,302 | ||||||
| Prepaid expenses | 11,484 | 11,054 | 4,731 | ||||||
| Plant assets, net |
330,773 |
305,125 | 266,304 | ||||||
| Total assets | $ | 616,779 | $ | 531,706 | $ | 434,400 | |||
| Liabilities and Equity | |||||||||
| Accounts payable | $ | 153,578 | $ | 90,757 | $ | 56,194 | |||
| Long-term notes payable secured by mortgages on plant assets |
118,274 | 124,738 | 97,922 | ||||||
| Common stock, $10 par value | 162,500 | 162,500 | 162,500 | ||||||
| Retained earnings | 182,427 | 153,711 | 117,784 | ||||||
| Total liabilities and equity | $ | 616,779 | $ | 531,706 | $ | 434,400 | |||
The company’s income statements for the years ended December 31,
2017 and 2016, follow.
| For Year Ended December 31 | 2017 | 2016 | ||||||||||
| Sales | $ | 801,813 | $ | 632,730 | ||||||||
| Cost of goods sold | $ | 489,106 | $ | 411,275 | ||||||||
| Other operating expenses | 248,562 | 160,081 | ||||||||||
| Interest expense | 13,631 | 14,553 | ||||||||||
| Income taxes | 10,424 | 9,491 | ||||||||||
| Total costs and expenses | 761,723 | 595,400 | ||||||||||
| Net income | $ | 40,090 | $ | 37,330 | ||||||||
| Earnings per share | $ | 2.47 | $ | 2.30 | ||||||||
Calculate the company’s long-term risk and capital structure
positions at the end of 2017 and 2016 by computing the following
ratios.
(2) Debt-to-equity ratio.
Simon Company’s year-end balance sheets follow.
| At December 31 | 2017 | 2016 | 2015 | ||||||
| Assets | |||||||||
| Cash | $ | 35,662 | $ | 42,962 | $ | 44,296 | |||
| Accounts receivable, net | 107,579 | 75,183 | 56,767 | ||||||
| Merchandise inventory | 131,281 | 97,382 | 62,302 | ||||||
| Prepaid expenses | 11,484 | 11,054 | 4,731 | ||||||
| Plant assets, net |
330,773 |
305,125 | 266,304 | ||||||
| Total assets | $ | 616,779 | $ | 531,706 | $ | 434,400 | |||
| Liabilities and Equity | |||||||||
| Accounts payable | $ | 153,578 | $ | 90,757 | $ | 56,194 | |||
| Long-term notes payable secured by mortgages on plant assets |
118,274 | 124,738 | 97,922 | ||||||
| Common stock, $10 par value | 162,500 | 162,500 | 162,500 | ||||||
| Retained earnings | 182,427 | 153,711 | 117,784 | ||||||
| Total liabilities and equity | $ | 616,779 | $ | 531,706 | $ | 434,400 | |||
The company’s income statements for the years ended December 31,
2017 and 2016, follow.
| For Year Ended December 31 | 2017 | 2016 | ||||||||||
| Sales | $ | 801,813 | $ | 632,730 | ||||||||
| Cost of goods sold | $ | 489,106 | $ | 411,275 | ||||||||
| Other operating expenses | 248,562 | 160,081 | ||||||||||
| Interest expense | 13,631 | 14,553 | ||||||||||
| Income taxes | 10,424 | 9,491 | ||||||||||
| Total costs and expenses | 761,723 | 595,400 | ||||||||||
| Net income | $ | 40,090 | $ | 37,330 | ||||||||
| Earnings per share | $ | 2.47 | $ | 2.30 | ||||||||
Calculate the company’s long-term risk and capital structure
positions at the end of 2017 and 2016 by computing the following
ratios.
(3) Times interest earned.
Homework Answers

Add Answer to:
Simon Company’s year-end balance sheets follow. At December 31 2017 2016 2015 Assets Cash $ 35,662...
Simon Company’s year-end balance sheets follow. At December 31 2017 2016 2015 Assets Cash $ 31,600...
Simon Company’s year-end balance sheets follow. At December 31 2017 2016 2015 Assets Cash $ 31,600 $ 34,600 $ 36,000 Accounts receivable, net 89,200 64,400 55,700 Merchandise inventory 68,818 84,700 50,700 Prepaid expenses 10,613 9,438 3,852 Plant assets, net 369,769 251,862 193,748 Total assets $ 570,000 $ 445,000 $ 340,000 Liabilities and Equity Accounts payable $ 140,511 $ 73,701 $ 44,880 Long-term notes payable secured by mortgages on plant assets 109,303 104,397 74,389 Common stock, $10 par value 162,500 162,500...
Simon Company’s year-end balance sheets follow. At December 31 2017 2016 2015 Assets Cash $ 33,443...
Simon Company’s year-end balance sheets follow. At December 31 2017 2016 2015 Assets Cash $ 33,443 $ 39,092 $ 41,136 Accounts receivable, net 89,200 62,600 55,400 Merchandise inventory 115,000 85,000 56,000 Prepaid expenses 10,770 10,262 4,571 Plant assets, net 329,991 301,670 266,893 Total assets $ 578,404 $ 498,624 $ 424,000 Liabilities and Equity Accounts payable $ 141,142 $ 82,582 $ 54,849 Long-term notes payable secured by mortgages on plant assets 106,565 112,390 91,830 Common stock, $10 par value 162,500 162,500...
Simon Company’s year-end balance sheets follow. At December 31 2017 2016 2015 Assets Cash $ 29,607...
Simon Company’s year-end balance sheets follow. At December 31 2017 2016 2015 Assets Cash $ 29,607 $ 34,608 $ 35,690 Accounts receivable, net 89,500 62,600 57,300 Merchandise inventory 110,500 84,500 51,000 Prepaid expenses 9,535 9,085 3,965 Plant assets, net 262,674 241,807 212,545 Total assets $ 501,816 $ 432,600 $ 360,500 Liabilities and Equity Accounts payable $ 124,952 $ 73,109 $ 47,586 Long-term notes payable secured by mortgages on plant assets 94,341 99,498 79,671 Common stock, $10 par value 162,500 162,500...
Simon Company’s year-end balance sheets follow. At December 31 2017 2016 2015 Assets Cash $ 27,923...
Simon Company’s year-end balance sheets follow. At December 31 2017 2016 2015 Assets Cash $ 27,923 $ 33,985 $ 32,679 Accounts receivable, net 85,935 58,886 45,369 Merchandise inventory 105,949 76,257 47,839 Prepaid expenses 9,270 8,833 3,743 Plant assets, net 258,832 242,650 210,670 Total assets $ 487,909 $ 420,611 $ 340,300 Liabilities and Equity Accounts payable $ 119,060 $ 71,083 $ 46,267 Long-term notes payable secured by mortgages on plant assets 92,644 93,838 75,206 Common stock, $10 par value 162,500 162,500...
Simon Company’s year-end balance sheets follow. At December 31 2017 2016 2015 Assets Cash $ 26,262...
Simon Company’s year-end balance sheets follow. At December 31 2017 2016 2015 Assets Cash $ 26,262 $ 30,391 $ 31,343 Accounts receivable, net 77,637 55,332 42,627 Merchandise inventory 98,570 70,278 44,508 Prepaid expenses 8,373 7,897 3,413 Plant assets, net 234,272 219,821 194,709 Total assets $ 445,114 $ 383,719 $ 316,600 Liabilities and Equity Accounts payable $ 107,508 $ 64,849 $ 41,791 Long-term notes payable secured by mortgages on plant assets 82,845 87,373 69,969 Common stock, $10 par value 162,500 162,500...
Simon Company’s year-end balance sheets follow. At December 31 2017 2016 2015 Assets Cash $ 31,300...
Simon Company’s year-end balance sheets follow. At December 31 2017 2016 2015 Assets Cash $ 31,300 $ 34,600 $ 36,000 Accounts receivable, net 89,000 63,100 52,700 Merchandise inventory 78,734 82,900 52,200 Prepaid expenses 10,070 8,849 4,138 Plant assets, net 320,896 240,551 234,962 Total assets $ 530,000 $ 430,000 $ 380,000 Liabilities and Equity Accounts payable $ 130,650 $ 73,397 $ 50,160 Long-term notes payable secured by mortgages on plant assets 98,644 98,900 81,461 Common stock, $10 par value 162,500 162,500...
Simon Company’s year-end balance sheets follow. At December 31 2017 2016 2015 Assets Cash $ 32,000...
Simon Company’s year-end balance sheets follow. At December 31 2017 2016 2015 Assets Cash $ 32,000 $ 34,900 $ 37,200 Accounts receivable, net 89,600 62,600 58,400 Merchandise inventory 66,406 83,500 50,900 Prepaid expenses 11,305 10,389 4,376 Plant assets, net 395,689 293,611 239,124 Total assets $ 595,000 $ 485,000 $ 390,000 Liabilities and Equity Accounts payable $ 149,637 $ 81,965 $ 51,480 Long-term notes payable secured by mortgages on plant assets 112,979 112,666 84,466 Common stock, $10 par value 162,500 162,500...
Simon Company’s year-end balance sheets follow. At December 31 2017 2016 2015 Assets Cash $ 36,335...
 Simon Company’s year-end balance sheets follow.
At December 31
2017
2016
2015
Assets
Cash
$
36,335
$
42,472
$
42,524
Accounts receivable, net
107,459
73,568
56,120
Merchandise inventory
139,163
102,226
60,994
Prepaid expenses
12,179
11,377
4,773
Plant assets, net
333,281
312,096
273,889
Total assets
$
628,417
$
541,739
$
438,300
Liabilities and Equity
Accounts payable
$
159,605
$
89,723
$
59,013
Long-term notes payable secured by
mortgages on plant assets
120,505
123,354
94,927
Common stock, $10 par value
162,500
162,500...
Simon Company’s year-end balance sheets follow.
At December 31
2017
2016
2015
Assets
Cash
$
36,335
$
42,472
$
42,524
Accounts receivable, net
107,459
73,568
56,120
Merchandise inventory
139,163
102,226
60,994
Prepaid expenses
12,179
11,377
4,773
Plant assets, net
333,281
312,096
273,889
Total assets
$
628,417
$
541,739
$
438,300
Liabilities and Equity
Accounts payable
$
159,605
$
89,723
$
59,013
Long-term notes payable secured by
mortgages on plant assets
120,505
123,354
94,927
Common stock, $10 par value
162,500
162,500...
Simon Company’s year-end balance sheets follow. At December 31 2017 2016 2015 Assets Cash $ 31,800...
 Simon Company’s year-end balance sheets follow.
At December 31
2017
2016
2015
Assets
Cash
$
31,800
$
36,000
$
37,200
Accounts receivable, net
88,100
62,000
50,500
Merchandise inventory
111,000
83,800
54,500
Prepaid expenses
10,300
9,350
4,600
Plant assets, net
280,000
257,000
235,000
Total assets
$
521,200
$
448,150
$
381,800
Liabilities and Equity
Accounts payable
$
129,200
$
75,250
$
50,400
Long-term notes payable secured by
mortgages on plant assets
98,000
100,000
82,600
Common stock, $10 par value
161,500
161,500...
Simon Company’s year-end balance sheets follow.
At December 31
2017
2016
2015
Assets
Cash
$
31,800
$
36,000
$
37,200
Accounts receivable, net
88,100
62,000
50,500
Merchandise inventory
111,000
83,800
54,500
Prepaid expenses
10,300
9,350
4,600
Plant assets, net
280,000
257,000
235,000
Total assets
$
521,200
$
448,150
$
381,800
Liabilities and Equity
Accounts payable
$
129,200
$
75,250
$
50,400
Long-term notes payable secured by
mortgages on plant assets
98,000
100,000
82,600
Common stock, $10 par value
161,500
161,500...
Simon Company’s year-end balance sheets follow. At December 31 2017 2016 2015 Assets Cash $ 27,904 $ 32...
 Simon Company’s year-end balance sheets follow.
At December 31
2017
2016
2015
Assets
Cash
$
27,904
$
32,617
$
34,676
Accounts receivable, net
89,700
62,600
59,700
Merchandise inventory
113,000
83,000
54,000
Prepaid expenses
8,986
8,562
3,853
Plant assets, net
247,981
233,541
208,871
Total assets
$
487,571
$
420,320
$
361,100
Liabilities and Equity
Accounts payable
$
117,763
$
68,903
$
46,235
Long-term notes payable secured by
mortgages on plant assets
88,913
93,773
77,409
Common stock, $10 par value
162,500
162,500...
Simon Company’s year-end balance sheets follow.
At December 31
2017
2016
2015
Assets
Cash
$
27,904
$
32,617
$
34,676
Accounts receivable, net
89,700
62,600
59,700
Merchandise inventory
113,000
83,000
54,000
Prepaid expenses
8,986
8,562
3,853
Plant assets, net
247,981
233,541
208,871
Total assets
$
487,571
$
420,320
$
361,100
Liabilities and Equity
Accounts payable
$
117,763
$
68,903
$
46,235
Long-term notes payable secured by
mortgages on plant assets
88,913
93,773
77,409
Common stock, $10 par value
162,500
162,500...
 Simon Company’s year-end balance sheets follow.
At December 31
2017
2016
2015
Assets
Cash
$
36,335
$
42,472
$
42,524
Accounts receivable, net
107,459
73,568
56,120
Merchandise inventory
139,163
102,226
60,994
Prepaid expenses
12,179
11,377
4,773
Plant assets, net
333,281
312,096
273,889
Total assets
$
628,417
$
541,739
$
438,300
Liabilities and Equity
Accounts payable
$
159,605
$
89,723
$
59,013
Long-term notes payable secured by
mortgages on plant assets
120,505
123,354
94,927
Common stock, $10 par value
162,500
162,500...
Simon Company’s year-end balance sheets follow.
At December 31
2017
2016
2015
Assets
Cash
$
36,335
$
42,472
$
42,524
Accounts receivable, net
107,459
73,568
56,120
Merchandise inventory
139,163
102,226
60,994
Prepaid expenses
12,179
11,377
4,773
Plant assets, net
333,281
312,096
273,889
Total assets
$
628,417
$
541,739
$
438,300
Liabilities and Equity
Accounts payable
$
159,605
$
89,723
$
59,013
Long-term notes payable secured by
mortgages on plant assets
120,505
123,354
94,927
Common stock, $10 par value
162,500
162,500...
 Simon Company’s year-end balance sheets follow.
At December 31
2017
2016
2015
Assets
Cash
$
31,800
$
36,000
$
37,200
Accounts receivable, net
88,100
62,000
50,500
Merchandise inventory
111,000
83,800
54,500
Prepaid expenses
10,300
9,350
4,600
Plant assets, net
280,000
257,000
235,000
Total assets
$
521,200
$
448,150
$
381,800
Liabilities and Equity
Accounts payable
$
129,200
$
75,250
$
50,400
Long-term notes payable secured by
mortgages on plant assets
98,000
100,000
82,600
Common stock, $10 par value
161,500
161,500...
Simon Company’s year-end balance sheets follow.
At December 31
2017
2016
2015
Assets
Cash
$
31,800
$
36,000
$
37,200
Accounts receivable, net
88,100
62,000
50,500
Merchandise inventory
111,000
83,800
54,500
Prepaid expenses
10,300
9,350
4,600
Plant assets, net
280,000
257,000
235,000
Total assets
$
521,200
$
448,150
$
381,800
Liabilities and Equity
Accounts payable
$
129,200
$
75,250
$
50,400
Long-term notes payable secured by
mortgages on plant assets
98,000
100,000
82,600
Common stock, $10 par value
161,500
161,500...
 Simon Company’s year-end balance sheets follow.
At December 31
2017
2016
2015
Assets
Cash
$
27,904
$
32,617
$
34,676
Accounts receivable, net
89,700
62,600
59,700
Merchandise inventory
113,000
83,000
54,000
Prepaid expenses
8,986
8,562
3,853
Plant assets, net
247,981
233,541
208,871
Total assets
$
487,571
$
420,320
$
361,100
Liabilities and Equity
Accounts payable
$
117,763
$
68,903
$
46,235
Long-term notes payable secured by
mortgages on plant assets
88,913
93,773
77,409
Common stock, $10 par value
162,500
162,500...
Simon Company’s year-end balance sheets follow.
At December 31
2017
2016
2015
Assets
Cash
$
27,904
$
32,617
$
34,676
Accounts receivable, net
89,700
62,600
59,700
Merchandise inventory
113,000
83,000
54,000
Prepaid expenses
8,986
8,562
3,853
Plant assets, net
247,981
233,541
208,871
Total assets
$
487,571
$
420,320
$
361,100
Liabilities and Equity
Accounts payable
$
117,763
$
68,903
$
46,235
Long-term notes payable secured by
mortgages on plant assets
88,913
93,773
77,409
Common stock, $10 par value
162,500
162,500...
Most questions answered within 3 hours.
-
Where is the error in this code sequence?
String s1 = "Hello";
String s2 = "ello";...
asked 10 months ago -
Financial data for Joel de Paris, Inc., for last year
follow:
Joel de Paris, Inc.
Balance...
asked 10 months ago -
Consider this reaction:
Al2(SO4)3 (aq)+ BaCl3
(aq) Al2Cl6 (aq)- +
3BaSO4(s) . What is the...
asked 10 months ago -
Suppose that Savneet is considering increasing her
recent random sample from 20 car rentals to 40...
asked 10 months ago -
Trucks arrive at an unloading terminal at an average rate of 120
per hour.
Trucks arrive...
asked 10 months ago -
Why are methanol and ethanol completely soluble in water while
octanol is not very little soluble....
asked 10 months ago -
A facilities manager at a university reads in a research report
that the mean amount of...
asked 10 months ago -
When the CuSO4 is rehydrated by adding water to the anhydrous
compound, is this an endothermic...
asked 10 months ago -
A ray of sunlight is passing from diamond into crown glass; the
angle of incidence is...
asked 10 months ago -
A block of mass 0.249 kg is placed on top of a light, vertical
spring of...
asked 10 months ago -
how do the kidneys compensate in the presences of acidosis
a) trigger hyperventilate
b) reserve acid...
asked 10 months ago -
Question 501 pts
The rental rate of capital to the firm increases. Which of the
following...
asked 10 months ago