
Homework Answers

Add Answer to:
2. You are given annual returns for stocks ABC and XYZ from the last 5 years:...
2. (13 points) The table below presents the returns on stocks ABC and XYZ for a...
 2. (13
points) The table below presents the returns on stocks ABC and XYZ
for a five- year period.
Year
ABC
XYZ
1
0.14
0.11
2
0.43
0.64
3
-0.05
-0.27
4
-0.26
-0.81
5
0.44
0.55
a. (3
points) Assume that the average returns from the data equals the
expected returns for the respective stocks. If you want to form a
portfolio with expected returns of 20%, what proportion of your
assets would you invest in each of these...
2. (13
points) The table below presents the returns on stocks ABC and XYZ
for a five- year period.
Year
ABC
XYZ
1
0.14
0.11
2
0.43
0.64
3
-0.05
-0.27
4
-0.26
-0.81
5
0.44
0.55
a. (3
points) Assume that the average returns from the data equals the
expected returns for the respective stocks. If you want to form a
portfolio with expected returns of 20%, what proportion of your
assets would you invest in each of these...
2. (13 points) The table below presents the returns on stocks ABC and XYZ for a...
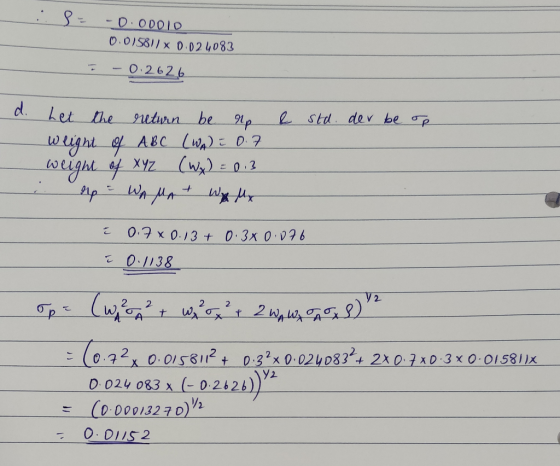
 2. (13 points) The table below presents the returns on stocks ABC and XYZ for a five- year period. Year 1 2 ABC 0.14 0.43 -0.05 -0.26 0.44 XYZ 0.11 0.64 -0.27 -0.81 0.55 3 4. a. (3 points) Assume that the average returns from the data equals the expected returns for the respective stocks. If you want to form a portfolio with expected returns of 20%, what proportion of your assets would you invest in each of these stocks?...
Please show working for all parts. 1. The annual returns of two stocks are given as...
 Please show working for all parts.
1. The annual returns of two stocks are given as follows. Year Stock A Stock B 2011 -10% 21% 2012 2013 20% 5% 7% 30% 2014 -5% -3% 2015 2% -8% 2016 9% 25% (a) Estimate the expected return and volatility of each stock. (b) Estimate the covariance and correlation between two stocks. (c) Find the expected returns and volatilities of portfolios that maintain 100.6% investment in Stock A and 100(1-x)% in Stock B,...
Please show working for all parts.
1. The annual returns of two stocks are given as follows. Year Stock A Stock B 2011 -10% 21% 2012 2013 20% 5% 7% 30% 2014 -5% -3% 2015 2% -8% 2016 9% 25% (a) Estimate the expected return and volatility of each stock. (b) Estimate the covariance and correlation between two stocks. (c) Find the expected returns and volatilities of portfolios that maintain 100.6% investment in Stock A and 100(1-x)% in Stock B,...
Consider the rate of return of stocks ABC and XYZ. 14 Year 2 3 ABC 20%...
 Consider the rate of return of stocks ABC and XYZ. 14 Year 2 3 ABC 20% 10 15 4 1 ΓΧΥΣ sex 12 18 1 -11 00:32:02 5 a. Calculate the arithmetic average return on these stocks over the sample period. (Do not round intermediate calculations. Round your answers to 2 decimal places.) Arithmetic Average ABC |XYZ b. Which stock has greater dispersion around the mean return? XYZ ОАВС c. Calculate the geometric average returns of each stock. What do...
Considering the following information of three stocks Stock Expected rate of return Standard deviation ABC 13%...
 Considering the following information of three stocks Stock Expected rate of return Standard deviation ABC 13% 20% XYZ 14% 20% MNO 15% 20% The correlation between ABC and XYZ is 0.36 The correlation between ABC and MNO is 0.52 The correlation between XYZ and MNO is 0.68 You decide to invest only in two stocks out of these three stocks. You want to choose a combination of two stocks that will create lower standard deviation. Half of your money will...
The realized returns for stock A and stock B from 2004-2009 are provided in the table...
 The realized returns for stock A and stock B from 2004-2009 are provided in the table below Year 2004 2005 2006 2007 2008 2009 Stock A -9% 21% 6% -4% 3% 10% Stock B 23% 9% 32% -1% -6% 27% (a) Calculate the expected returns (as percents) over the next year for the stocks assuming the average annual realized returns and past volatility from 2004-2009 are unbiased estimators of expected returns and future volatility. stock A 4.5 stock B 14...
Please show work and all steps! The realized returns for stock A and stock B from...
 Please show work and all steps!
The realized returns for stock A and stock B from 2004-2009 are provided in the table below Year 2004 2005 2006 2007 2008 2009 Stock A -8% 22% 7% -3% 4% 11% Stock B 20% 6% 29% -4% -9% 24% Suppose you create a portfolio that is 60% invested in stock A and 40% invested in stock B. The correlation between the returns of the two stocks is 6.27% (a) Calculate the expected return...
Please show work and all steps!
The realized returns for stock A and stock B from 2004-2009 are provided in the table below Year 2004 2005 2006 2007 2008 2009 Stock A -8% 22% 7% -3% 4% 11% Stock B 20% 6% 29% -4% -9% 24% Suppose you create a portfolio that is 60% invested in stock A and 40% invested in stock B. The correlation between the returns of the two stocks is 6.27% (a) Calculate the expected return...
Suppose you have collected the following historical returns for 2 stocks (Stock A and Stock B)....
Suppose you have collected the following historical returns for 2 stocks (Stock A and Stock B). Your task is to summarize the data using the following statistical measures: expected return, variance, standard deviation, covariance, and correlation. Stock A Stock B 2010 0.10 0.07 2009 -0.02 0.01 2008 0.08 -0.03 Estimate the expected return for each stock. In a short description, what do these numbers represent? (For the quiz, provide the expected return for Stock A.) Estimate the return variance and...
Need help with this question: The expected returns for Securities ABC and XYZ are 8 percent...
Need help with this question: The expected returns for Securities ABC and XYZ are 8 percent and 13 percent, respectively. The standard deviation is 12 percent for ABC and 18 percent for XYZ. There is no relationship between the returns on the two securities. The market return is 12.5 percent with a standard deviation of 16 percent. The risk-free rate is 5 percent. Which of the following is not an efficient portfolio as determined by the lowest Sharpe ratio? 100%...
The realized returns for stock A and stock B from 2004–2009 are provided in the table...
The realized returns for stock A and stock B from 2004–2009 are provided in the table below Year 2004 2005 2006 2007 2008 2009 Stock A −9% 21% 6% −4% 3% 10% Stock B 19% 5% 28% −5% −10% 23% (a) Calculate the expected returns (as percents) over the next year for the stocks assuming the average annual realized returns and past volatility from 2004–2009 are unbiased estimators of expected returns and future volatility. stock A %stock B % Calculate...
 2. (13
points) The table below presents the returns on stocks ABC and XYZ
for a five- year period.
Year
ABC
XYZ
1
0.14
0.11
2
0.43
0.64
3
-0.05
-0.27
4
-0.26
-0.81
5
0.44
0.55
a. (3
points) Assume that the average returns from the data equals the
expected returns for the respective stocks. If you want to form a
portfolio with expected returns of 20%, what proportion of your
assets would you invest in each of these...
2. (13
points) The table below presents the returns on stocks ABC and XYZ
for a five- year period.
Year
ABC
XYZ
1
0.14
0.11
2
0.43
0.64
3
-0.05
-0.27
4
-0.26
-0.81
5
0.44
0.55
a. (3
points) Assume that the average returns from the data equals the
expected returns for the respective stocks. If you want to form a
portfolio with expected returns of 20%, what proportion of your
assets would you invest in each of these...
 2. (13 points) The table below presents the returns on stocks ABC and XYZ for a five- year period. Year 1 2 ABC 0.14 0.43 -0.05 -0.26 0.44 XYZ 0.11 0.64 -0.27 -0.81 0.55 3 4. a. (3 points) Assume that the average returns from the data equals the expected returns for the respective stocks. If you want to form a portfolio with expected returns of 20%, what proportion of your assets would you invest in each of these stocks?...
 Please show working for all parts.
1. The annual returns of two stocks are given as follows. Year Stock A Stock B 2011 -10% 21% 2012 2013 20% 5% 7% 30% 2014 -5% -3% 2015 2% -8% 2016 9% 25% (a) Estimate the expected return and volatility of each stock. (b) Estimate the covariance and correlation between two stocks. (c) Find the expected returns and volatilities of portfolios that maintain 100.6% investment in Stock A and 100(1-x)% in Stock B,...
Please show working for all parts.
1. The annual returns of two stocks are given as follows. Year Stock A Stock B 2011 -10% 21% 2012 2013 20% 5% 7% 30% 2014 -5% -3% 2015 2% -8% 2016 9% 25% (a) Estimate the expected return and volatility of each stock. (b) Estimate the covariance and correlation between two stocks. (c) Find the expected returns and volatilities of portfolios that maintain 100.6% investment in Stock A and 100(1-x)% in Stock B,...
 Consider the rate of return of stocks ABC and XYZ. 14 Year 2 3 ABC 20% 10 15 4 1 ΓΧΥΣ sex 12 18 1 -11 00:32:02 5 a. Calculate the arithmetic average return on these stocks over the sample period. (Do not round intermediate calculations. Round your answers to 2 decimal places.) Arithmetic Average ABC |XYZ b. Which stock has greater dispersion around the mean return? XYZ ОАВС c. Calculate the geometric average returns of each stock. What do...
 Considering the following information of three stocks Stock Expected rate of return Standard deviation ABC 13% 20% XYZ 14% 20% MNO 15% 20% The correlation between ABC and XYZ is 0.36 The correlation between ABC and MNO is 0.52 The correlation between XYZ and MNO is 0.68 You decide to invest only in two stocks out of these three stocks. You want to choose a combination of two stocks that will create lower standard deviation. Half of your money will...
 The realized returns for stock A and stock B from 2004-2009 are provided in the table below Year 2004 2005 2006 2007 2008 2009 Stock A -9% 21% 6% -4% 3% 10% Stock B 23% 9% 32% -1% -6% 27% (a) Calculate the expected returns (as percents) over the next year for the stocks assuming the average annual realized returns and past volatility from 2004-2009 are unbiased estimators of expected returns and future volatility. stock A 4.5 stock B 14...
 Please show work and all steps!
The realized returns for stock A and stock B from 2004-2009 are provided in the table below Year 2004 2005 2006 2007 2008 2009 Stock A -8% 22% 7% -3% 4% 11% Stock B 20% 6% 29% -4% -9% 24% Suppose you create a portfolio that is 60% invested in stock A and 40% invested in stock B. The correlation between the returns of the two stocks is 6.27% (a) Calculate the expected return...
Please show work and all steps!
The realized returns for stock A and stock B from 2004-2009 are provided in the table below Year 2004 2005 2006 2007 2008 2009 Stock A -8% 22% 7% -3% 4% 11% Stock B 20% 6% 29% -4% -9% 24% Suppose you create a portfolio that is 60% invested in stock A and 40% invested in stock B. The correlation between the returns of the two stocks is 6.27% (a) Calculate the expected return...
Most questions answered within 3 hours.
-
Where is the error in this code sequence?
String s1 = "Hello";
String s2 = "ello";...
asked 10 months ago -
Financial data for Joel de Paris, Inc., for last year
follow:
Joel de Paris, Inc.
Balance...
asked 10 months ago -
Consider this reaction:
Al2(SO4)3 (aq)+ BaCl3
(aq) Al2Cl6 (aq)- +
3BaSO4(s) . What is the...
asked 10 months ago -
Suppose that Savneet is considering increasing her
recent random sample from 20 car rentals to 40...
asked 10 months ago -
Trucks arrive at an unloading terminal at an average rate of 120
per hour.
Trucks arrive...
asked 10 months ago -
Why are methanol and ethanol completely soluble in water while
octanol is not very little soluble....
asked 10 months ago -
A facilities manager at a university reads in a research report
that the mean amount of...
asked 10 months ago -
When the CuSO4 is rehydrated by adding water to the anhydrous
compound, is this an endothermic...
asked 10 months ago -
A ray of sunlight is passing from diamond into crown glass; the
angle of incidence is...
asked 10 months ago -
A block of mass 0.249 kg is placed on top of a light, vertical
spring of...
asked 10 months ago -
how do the kidneys compensate in the presences of acidosis
a) trigger hyperventilate
b) reserve acid...
asked 10 months ago -
Question 501 pts
The rental rate of capital to the firm increases. Which of the
following...
asked 10 months ago