
Homework Answers
Let x be the annual return of S&P 500 index
We are given x follows normal distribution with Mean = 11.5 and
standard deviation
= 18
Part a) We are asked to find two limits ( a and b) such that
area between them is 50%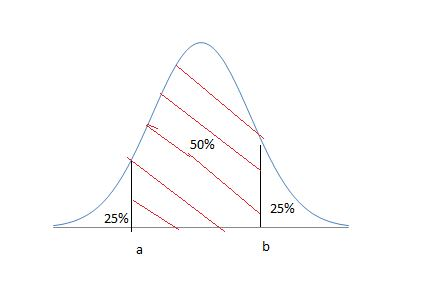
The total area under the curve is 100% , then middle area between a and b is 50% therefore area to the left of a is 25% and area to the right of b is 25%
Now we have to find z score corresponding to limit "a" and limit "b" , we can use excel function =NORMSINV(area to the left)
For a,
Area to the left of a is 0.25 or 25%, So type function =NORMSINV( 0.25 ) in the excel,
We will get z score corresponding to "a"= -0.6745
Therefore a = z*σ + µ
= -0.6745*18 + 11.5
a = 0.641%
For b,
Total area to the left of b is ( 0.25+0.50) = 0.75 , So type function =NORMSINV( 0.75 ) in the excel,
We will get z score corresponding to "b"= 0.6745
Therefore b = z*σ + µ
= 0.6745*18 + 11.5
b = 23.641%
Part b) We are asked to find Probability x is less than 0 ; P( x < 0 )
First we need to find z score for x = 0
z =
=
z = -0.6389
To find area less than the z , we can use excel function =NORMSDIST( z )
So type =NORMSDIST( -0.6389 )in the excel.
We got 0.26145 or 26.145%
Part c)
We are asked to find Probability x is greater than 20 ; P( x > 20)
First we need to find z score for x = 20
z =
=
z = 0.4722
To find area greater than the z , we can use excel function = 1 - NORMSDIST( z )
So type =1 - NORMSDIST( 0.4722 )in the excel.
We got 0.31838 or 31.838%
Add Answer to:
3. A stock index consists of the market value of a collection of stocks. The rate...
The major stock market indexes had strong results in 2014. The mean one-year return for stocks...
The major stock market indexes had strong results in 2014. The mean one-year return for stocks in the S&P 500, a group of 500 very large companies was +11.4%. The mean one year return for the NASDAQ, a group of 3200 small and medium-sized companies was +13.4%. Historically, the one-year returns are approximately normal, the standard deviation in the S&P 500 is approximately 20% and the standard deviation in NASDAQ is approximately 30%. What is the probability that a stock...
Here are the results of a monthly index model of stock returns for FinCorp Stock: r(Fincorp)...
Here are the results of a monthly index model of stock returns for FinCorp Stock: r(Fincorp) = .001 + .8 r(S&P500) + e The standard deviation of the monthly return on the S&P 500 was .05. The standard deviation of the monthly value of the residual, e, was .03. What was the variance of the return on FinCorp stock? Remember that e and the return on the S&P 500 are essentially uncorrelated. What was the standard deviation of the return...
You are managing a portfolio of common stocks with a current market value of $100 million. You have decided to hedg...
 You are managing a portfolio of common stocks with a current market value of $100 million. You have decided to hedge the price risk for approximately half of the portfolio using CME S&P 500 stock index futures contracts because you believe half of your portfolio's market value moves comparably with this index. Assume the CME S&P 500 stock index futures contract costs $250 per contract times the stated stock market index level. If you agree to sell futures contracts on...
A stock has a Beta of 1.23, the expected return on the S&P 500 market index...
A stock has a Beta of 1.23, the expected return on the S&P 500 market index is 5.6%, and the return on T-Bills is 1.5%. Using the CAPM, what is the expected return on this stock? Enter your answer as a decimal with a leading zero and 4 decimal places of precision (i.e. 0.1234).
1. Stock prices and stand-alone risk The S&P 500 Index is one of the most commonly...
 1. Stock prices and stand-alone risk The S&P 500 Index is one of the most commonly used benchmark indices for the U.S. equity markets. Consisting of 500 companies, it is a market value-weighted index. This means that each company's performance is reflected in the index, weighted by the ratio of the company's value to the total value of all the companies. Based on your understanding of P/E ratios, in which of the following situations would the average trailing P/E ratio...
Level II: a) Write a summary of US stock market in 2018, include S&P 500 index...
 Level II: a) Write a summary of US stock market in 2018, include S&P 500 index return, key issues facing the market and economy and major events from the Fed.
Write a summary of US stock market in 2018, include S&P 500 index return, key issues...
Write a summary of US stock market in 2018, include S&P 500 index return, key issues facing the market and economy and major events from the Fed.
Consider the two (excess return) index-model regression results for stocks A and B. The risk-free rate...
 Consider the two (excess return) index-model regression results
for stocks A and B. The risk-free rate over the
period was 7%, and the market’s average return was 14%. Performance
is measured using an index model regression on excess returns.
Consider the two excess return) index-model regression results for stocks A and B. The risk-free rate over the period was 7%, and the market's average return was 14%. Performance is measured using an index model regression on excess returns Stock A...
Consider the two (excess return) index-model regression results
for stocks A and B. The risk-free rate over the
period was 7%, and the market’s average return was 14%. Performance
is measured using an index model regression on excess returns.
Consider the two excess return) index-model regression results for stocks A and B. The risk-free rate over the period was 7%, and the market's average return was 14%. Performance is measured using an index model regression on excess returns Stock A...
You have fixed index annuity which is credited with returns based on the investment gains of...
 You have fixed index annuity which is credited with returns based on the investment gains of the S&P 500 stock index. The annuity is subject to a participation rate of 70 percent and a maximum annual return of 8 percent. During the current year, the S&P 500 index increased from 2,000 to 2,200. Based on this result, what overall interest rate would be credited to the policy this year? (Express your answer as a percent and round to two decimal...
The following three defense stocks are to be combined into a stock index in January 2016...
The following three defense stocks are to be combined into a stock index in January 2016 (perhaps a portfolio manager believes these stocks are an appropriate benchmark for his or her performance). Assume the index is scaled by a factor of 10 million; that is, if the total value of all firms in the market is $5 billion, the index would be quoted as 500. Price Shares (millions) 1/1/16 1/1/17 1/1/18 Douglas McDonnell 350 $ 65 $ 69 $ 81...
 You are managing a portfolio of common stocks with a current market value of $100 million. You have decided to hedge the price risk for approximately half of the portfolio using CME S&P 500 stock index futures contracts because you believe half of your portfolio's market value moves comparably with this index. Assume the CME S&P 500 stock index futures contract costs $250 per contract times the stated stock market index level. If you agree to sell futures contracts on...
 1. Stock prices and stand-alone risk The S&P 500 Index is one of the most commonly used benchmark indices for the U.S. equity markets. Consisting of 500 companies, it is a market value-weighted index. This means that each company's performance is reflected in the index, weighted by the ratio of the company's value to the total value of all the companies. Based on your understanding of P/E ratios, in which of the following situations would the average trailing P/E ratio...
 Level II: a) Write a summary of US stock market in 2018, include S&P 500 index return, key issues facing the market and economy and major events from the Fed.
 Consider the two (excess return) index-model regression results
for stocks A and B. The risk-free rate over the
period was 7%, and the market’s average return was 14%. Performance
is measured using an index model regression on excess returns.
Consider the two excess return) index-model regression results for stocks A and B. The risk-free rate over the period was 7%, and the market's average return was 14%. Performance is measured using an index model regression on excess returns Stock A...
Consider the two (excess return) index-model regression results
for stocks A and B. The risk-free rate over the
period was 7%, and the market’s average return was 14%. Performance
is measured using an index model regression on excess returns.
Consider the two excess return) index-model regression results for stocks A and B. The risk-free rate over the period was 7%, and the market's average return was 14%. Performance is measured using an index model regression on excess returns Stock A...
 You have fixed index annuity which is credited with returns based on the investment gains of the S&P 500 stock index. The annuity is subject to a participation rate of 70 percent and a maximum annual return of 8 percent. During the current year, the S&P 500 index increased from 2,000 to 2,200. Based on this result, what overall interest rate would be credited to the policy this year? (Express your answer as a percent and round to two decimal...
Most questions answered within 3 hours.
-
Where is the error in this code sequence?
String s1 = "Hello";
String s2 = "ello";...
asked 11 months ago -
Financial data for Joel de Paris, Inc., for last year
follow:
Joel de Paris, Inc.
Balance...
asked 11 months ago -
Consider this reaction:
Al2(SO4)3 (aq)+ BaCl3
(aq) Al2Cl6 (aq)- +
3BaSO4(s) . What is the...
asked 11 months ago -
Suppose that Savneet is considering increasing her
recent random sample from 20 car rentals to 40...
asked 11 months ago -
Trucks arrive at an unloading terminal at an average rate of 120
per hour.
Trucks arrive...
asked 11 months ago -
Why are methanol and ethanol completely soluble in water while
octanol is not very little soluble....
asked 11 months ago -
A facilities manager at a university reads in a research report
that the mean amount of...
asked 11 months ago -
When the CuSO4 is rehydrated by adding water to the anhydrous
compound, is this an endothermic...
asked 11 months ago -
A ray of sunlight is passing from diamond into crown glass; the
angle of incidence is...
asked 11 months ago -
A block of mass 0.249 kg is placed on top of a light, vertical
spring of...
asked 11 months ago -
how do the kidneys compensate in the presences of acidosis
a) trigger hyperventilate
b) reserve acid...
asked 11 months ago -
Question 501 pts
The rental rate of capital to the firm increases. Which of the
following...
asked 11 months ago