
Homework Answers
SOLUTION-
The best linear fit line is below. Graph is between V (y-axis)
and R (x-axis). Compare  with graph equation we get


Now power fitted curve is below-
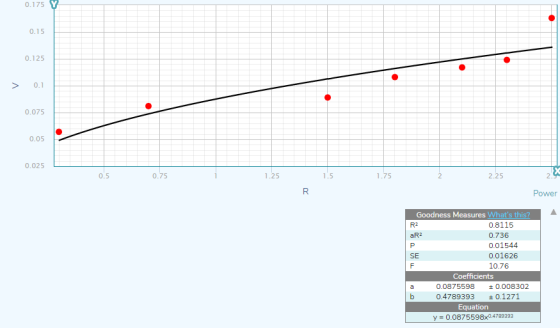
Compare given equation  with fitted curve equation we get

I will be glad to see your comment if you have any query and thumb up if you are satisfied. Thanks...
Add Answer to:
Data collected in an experiment were as follkowing 30057 0.08t o.o89 0.108 03 0.7 1.8 2.1...
A group of physics students collected data from a test of the projectile motion problem that...
 A group of physics students collected data from a test of the projectile motion problem that was analyzed in a previous lab exercise (L5). In their test, the students varied the angle and initial velocity Vo at which the projectile was launched, and then measured the resulting time of flight (tright). Note that tright was the dependent variable, while and Vo were independent variables. The results are listed below. (degrees) Time of Flight (s) Initial Velocity V. (m/s) 15 20...
csn i get the m file for mathlab plz QUESTION #2 ture-conductivity data in Table 1 is from a material that is known to follow Arrhenius The temperat law: -1000 S Аевт Perform a least squares...
 csn i get the m file for mathlab plz
QUESTION #2 ture-conductivity data in Table 1 is from a material that is known to follow Arrhenius The temperat law: -1000 S Аевт Perform a least squares regression analysis to find the best-fit values for A and B. Find also the R'value, where B T S-S Plot a graph to show the data points together with the best-fit curve. o wrse Save your main m-file: 02_studentID.m Write the program such that...
csn i get the m file for mathlab plz
QUESTION #2 ture-conductivity data in Table 1 is from a material that is known to follow Arrhenius The temperat law: -1000 S Аевт Perform a least squares regression analysis to find the best-fit values for A and B. Find also the R'value, where B T S-S Plot a graph to show the data points together with the best-fit curve. o wrse Save your main m-file: 02_studentID.m Write the program such that...
8-10 S. Bell recorded data and used her graphing calculator to find the equation for the...
 8-10
S. Bell recorded data and used her graphing calculator to find the equation for the line of best fit. She then used the correlation coefficient to determine the strength of the linear fit. Which correlation coefficient represents the strongest linear relationship? 1) 0.9 2) 0.5 3) -0.3 4) -0.8 9. The results of a linear regression are shown below. y- ax+b a-1.15785 b-139.3171772 r--0.896557832 20.8038159461 Which phrase best describes the relationship between x and y? 1) strong negative correlation...
8-10
S. Bell recorded data and used her graphing calculator to find the equation for the line of best fit. She then used the correlation coefficient to determine the strength of the linear fit. Which correlation coefficient represents the strongest linear relationship? 1) 0.9 2) 0.5 3) -0.3 4) -0.8 9. The results of a linear regression are shown below. y- ax+b a-1.15785 b-139.3171772 r--0.896557832 20.8038159461 Which phrase best describes the relationship between x and y? 1) strong negative correlation...
2. After you have collected all of your data, open the experiment file called Dependence of...
 2. After you have collected all of your data, open the experiment file called Dependence of C (LOSA 1-2). Enter your data for capacitance and either sep aration or area from Table 8-1 into the table in the software. Graph capacitance vs. either separation or area. Print the graph and affix it to these pages, 3. If your graph looks like a straight line, use the fit routine in the software to find its equation. If not, you should try...
Please help!!! Very urgent 1362 Pre-laboratory Aetivity for Coefficient of Linear Expansion Refer to: EIU Physies...
 Please help!!! Very urgent
1362 Pre-laboratory Aetivity for Coefficient of Linear Expansion Refer to: EIU Physies Department Laboratory Manual SP 2003, EIU Department of Physics and An Introduction to Error Analysis: The Study of Uncertainties in Physical Measurements 2d ed.. John R. Taylor. University Science Books, CA, 1997 Review of Least Squares Fit to a Line We often search for linear relationships between variables. In PHY 1352 the method of least squares was used as a technique to find the...
Please help!!! Very urgent
1362 Pre-laboratory Aetivity for Coefficient of Linear Expansion Refer to: EIU Physies Department Laboratory Manual SP 2003, EIU Department of Physics and An Introduction to Error Analysis: The Study of Uncertainties in Physical Measurements 2d ed.. John R. Taylor. University Science Books, CA, 1997 Review of Least Squares Fit to a Line We often search for linear relationships between variables. In PHY 1352 the method of least squares was used as a technique to find the...
Use matlab a) Create a simulated data set b) Create a set of plots to determine...
 Use matlab
a) Create a simulated data set b) Create a set of plots to determine the best transformation to linearize the data c) Fit a first order polynomial (y mx + b) to the linearized data to find the constants m and b d) Reconstruct the original equation from m and b in the linear fitted polynomial e) Plot the fitted equation. Radioactive decay is modeled by the equation: rt where A the amount of mass as a function...
Use matlab
a) Create a simulated data set b) Create a set of plots to determine the best transformation to linearize the data c) Fit a first order polynomial (y mx + b) to the linearized data to find the constants m and b d) Reconstruct the original equation from m and b in the linear fitted polynomial e) Plot the fitted equation. Radioactive decay is modeled by the equation: rt where A the amount of mass as a function...
Problem 1 Use the trapezoidal rule technique to approximate the following integrals: a) 「(x2+1)d...
 help wanted??
thank you
explain correctly
Problem 1 Use the trapezoidal rule technique to approximate the following integrals: a) 「(x2+1)dr(Note: use 0.5 increments forx) b) sina d INote: use a MATLAB function to subdivide the interval into eight equal parts) c e dx (Note: use 0.25 increments for x Problem 2 Use the Simpson's rule to evaluate the following integrals aDdr Problem 3: Given the polynomial: x3-6x2 + 30-0, Use MATLAB to find all roots of this polynomial. Use MATLAB's...
help wanted??
thank you
explain correctly
Problem 1 Use the trapezoidal rule technique to approximate the following integrals: a) 「(x2+1)dr(Note: use 0.5 increments forx) b) sina d INote: use a MATLAB function to subdivide the interval into eight equal parts) c e dx (Note: use 0.25 increments for x Problem 2 Use the Simpson's rule to evaluate the following integrals aDdr Problem 3: Given the polynomial: x3-6x2 + 30-0, Use MATLAB to find all roots of this polynomial. Use MATLAB's...
(I) Let's start with very simple data table 1.0 2.0 3.0 4.0 5.0 6.0 -1 ±...
 (I) Let's start with very simple data table 1.0 2.0 3.0 4.0 5.0 6.0 -1 ± 1.8 4±2.0 9+ 1.0 14 + 0.8 19 s 0.8 24 + 1.2 2% 1.8 34 ± 2.0 7.0 8.0 9.0 1. Plot a graph of y vs. X on a piece of graph paper 2. Is it a straight line? Draw the best-fit line. 3. Compute the slope and y-intercept for this line. Write the equation for y in terms of x using...
For this exercise we will run a regression using Swiss demographic data from around 1888. The...
 For this exercise we will run a regression using Swiss demographic data from around 1888. The sample is a cross-section of French speaking counties in Switzerland This data come with the R package datasets. The first step is to load the package into your current environment by typing the command libraryldatasets) in to the R console. This loads a number of datasets including one called swiss. Type help/swiss) in the console for additional details. The basic variable definitions are as...
Can you please answers these four questions as aoin as possible please and thank you! Given...
 Can you please answers these four questions as aoin as
possible please and thank you!
Given are five observations for two variables, z and y 5 13 20 18 48 57 11 27 a. Choose the corre rect scatter diagram for these data: A. B. 60+ 60 50 50 40 40 30+ 30 20 20 10 10- 10 20 30 40 50 60 x 10 20 30 40 50 60 57 x y 60 60 50+ 50- 40- 40+ 30-...
Can you please answers these four questions as aoin as
possible please and thank you!
Given are five observations for two variables, z and y 5 13 20 18 48 57 11 27 a. Choose the corre rect scatter diagram for these data: A. B. 60+ 60 50 50 40 40 30+ 30 20 20 10 10- 10 20 30 40 50 60 x 10 20 30 40 50 60 57 x y 60 60 50+ 50- 40- 40+ 30-...
 A group of physics students collected data from a test of the projectile motion problem that was analyzed in a previous lab exercise (L5). In their test, the students varied the angle and initial velocity Vo at which the projectile was launched, and then measured the resulting time of flight (tright). Note that tright was the dependent variable, while and Vo were independent variables. The results are listed below. (degrees) Time of Flight (s) Initial Velocity V. (m/s) 15 20...
 csn i get the m file for mathlab plz
QUESTION #2 ture-conductivity data in Table 1 is from a material that is known to follow Arrhenius The temperat law: -1000 S Аевт Perform a least squares regression analysis to find the best-fit values for A and B. Find also the R'value, where B T S-S Plot a graph to show the data points together with the best-fit curve. o wrse Save your main m-file: 02_studentID.m Write the program such that...
csn i get the m file for mathlab plz
QUESTION #2 ture-conductivity data in Table 1 is from a material that is known to follow Arrhenius The temperat law: -1000 S Аевт Perform a least squares regression analysis to find the best-fit values for A and B. Find also the R'value, where B T S-S Plot a graph to show the data points together with the best-fit curve. o wrse Save your main m-file: 02_studentID.m Write the program such that...
 8-10
S. Bell recorded data and used her graphing calculator to find the equation for the line of best fit. She then used the correlation coefficient to determine the strength of the linear fit. Which correlation coefficient represents the strongest linear relationship? 1) 0.9 2) 0.5 3) -0.3 4) -0.8 9. The results of a linear regression are shown below. y- ax+b a-1.15785 b-139.3171772 r--0.896557832 20.8038159461 Which phrase best describes the relationship between x and y? 1) strong negative correlation...
8-10
S. Bell recorded data and used her graphing calculator to find the equation for the line of best fit. She then used the correlation coefficient to determine the strength of the linear fit. Which correlation coefficient represents the strongest linear relationship? 1) 0.9 2) 0.5 3) -0.3 4) -0.8 9. The results of a linear regression are shown below. y- ax+b a-1.15785 b-139.3171772 r--0.896557832 20.8038159461 Which phrase best describes the relationship between x and y? 1) strong negative correlation...
 2. After you have collected all of your data, open the experiment file called Dependence of C (LOSA 1-2). Enter your data for capacitance and either sep aration or area from Table 8-1 into the table in the software. Graph capacitance vs. either separation or area. Print the graph and affix it to these pages, 3. If your graph looks like a straight line, use the fit routine in the software to find its equation. If not, you should try...
 Please help!!! Very urgent
1362 Pre-laboratory Aetivity for Coefficient of Linear Expansion Refer to: EIU Physies Department Laboratory Manual SP 2003, EIU Department of Physics and An Introduction to Error Analysis: The Study of Uncertainties in Physical Measurements 2d ed.. John R. Taylor. University Science Books, CA, 1997 Review of Least Squares Fit to a Line We often search for linear relationships between variables. In PHY 1352 the method of least squares was used as a technique to find the...
Please help!!! Very urgent
1362 Pre-laboratory Aetivity for Coefficient of Linear Expansion Refer to: EIU Physies Department Laboratory Manual SP 2003, EIU Department of Physics and An Introduction to Error Analysis: The Study of Uncertainties in Physical Measurements 2d ed.. John R. Taylor. University Science Books, CA, 1997 Review of Least Squares Fit to a Line We often search for linear relationships between variables. In PHY 1352 the method of least squares was used as a technique to find the...
 Use matlab
a) Create a simulated data set b) Create a set of plots to determine the best transformation to linearize the data c) Fit a first order polynomial (y mx + b) to the linearized data to find the constants m and b d) Reconstruct the original equation from m and b in the linear fitted polynomial e) Plot the fitted equation. Radioactive decay is modeled by the equation: rt where A the amount of mass as a function...
Use matlab
a) Create a simulated data set b) Create a set of plots to determine the best transformation to linearize the data c) Fit a first order polynomial (y mx + b) to the linearized data to find the constants m and b d) Reconstruct the original equation from m and b in the linear fitted polynomial e) Plot the fitted equation. Radioactive decay is modeled by the equation: rt where A the amount of mass as a function...
 help wanted??
thank you
explain correctly
Problem 1 Use the trapezoidal rule technique to approximate the following integrals: a) 「(x2+1)dr(Note: use 0.5 increments forx) b) sina d INote: use a MATLAB function to subdivide the interval into eight equal parts) c e dx (Note: use 0.25 increments for x Problem 2 Use the Simpson's rule to evaluate the following integrals aDdr Problem 3: Given the polynomial: x3-6x2 + 30-0, Use MATLAB to find all roots of this polynomial. Use MATLAB's...
help wanted??
thank you
explain correctly
Problem 1 Use the trapezoidal rule technique to approximate the following integrals: a) 「(x2+1)dr(Note: use 0.5 increments forx) b) sina d INote: use a MATLAB function to subdivide the interval into eight equal parts) c e dx (Note: use 0.25 increments for x Problem 2 Use the Simpson's rule to evaluate the following integrals aDdr Problem 3: Given the polynomial: x3-6x2 + 30-0, Use MATLAB to find all roots of this polynomial. Use MATLAB's...
 (I) Let's start with very simple data table 1.0 2.0 3.0 4.0 5.0 6.0 -1 ± 1.8 4±2.0 9+ 1.0 14 + 0.8 19 s 0.8 24 + 1.2 2% 1.8 34 ± 2.0 7.0 8.0 9.0 1. Plot a graph of y vs. X on a piece of graph paper 2. Is it a straight line? Draw the best-fit line. 3. Compute the slope and y-intercept for this line. Write the equation for y in terms of x using...
 For this exercise we will run a regression using Swiss demographic data from around 1888. The sample is a cross-section of French speaking counties in Switzerland This data come with the R package datasets. The first step is to load the package into your current environment by typing the command libraryldatasets) in to the R console. This loads a number of datasets including one called swiss. Type help/swiss) in the console for additional details. The basic variable definitions are as...
 Can you please answers these four questions as aoin as
possible please and thank you!
Given are five observations for two variables, z and y 5 13 20 18 48 57 11 27 a. Choose the corre rect scatter diagram for these data: A. B. 60+ 60 50 50 40 40 30+ 30 20 20 10 10- 10 20 30 40 50 60 x 10 20 30 40 50 60 57 x y 60 60 50+ 50- 40- 40+ 30-...
Can you please answers these four questions as aoin as
possible please and thank you!
Given are five observations for two variables, z and y 5 13 20 18 48 57 11 27 a. Choose the corre rect scatter diagram for these data: A. B. 60+ 60 50 50 40 40 30+ 30 20 20 10 10- 10 20 30 40 50 60 x 10 20 30 40 50 60 57 x y 60 60 50+ 50- 40- 40+ 30-...
Most questions answered within 3 hours.
-
Where is the error in this code sequence?
String s1 = "Hello";
String s2 = "ello";...
asked 10 months ago -
Financial data for Joel de Paris, Inc., for last year
follow:
Joel de Paris, Inc.
Balance...
asked 10 months ago -
Consider this reaction:
Al2(SO4)3 (aq)+ BaCl3
(aq) Al2Cl6 (aq)- +
3BaSO4(s) . What is the...
asked 10 months ago -
Suppose that Savneet is considering increasing her
recent random sample from 20 car rentals to 40...
asked 10 months ago -
Trucks arrive at an unloading terminal at an average rate of 120
per hour.
Trucks arrive...
asked 10 months ago -
Why are methanol and ethanol completely soluble in water while
octanol is not very little soluble....
asked 10 months ago -
A facilities manager at a university reads in a research report
that the mean amount of...
asked 10 months ago -
When the CuSO4 is rehydrated by adding water to the anhydrous
compound, is this an endothermic...
asked 10 months ago -
A ray of sunlight is passing from diamond into crown glass; the
angle of incidence is...
asked 10 months ago -
A block of mass 0.249 kg is placed on top of a light, vertical
spring of...
asked 10 months ago -
how do the kidneys compensate in the presences of acidosis
a) trigger hyperventilate
b) reserve acid...
asked 10 months ago -
Question 501 pts
The rental rate of capital to the firm increases. Which of the
following...
asked 10 months ago