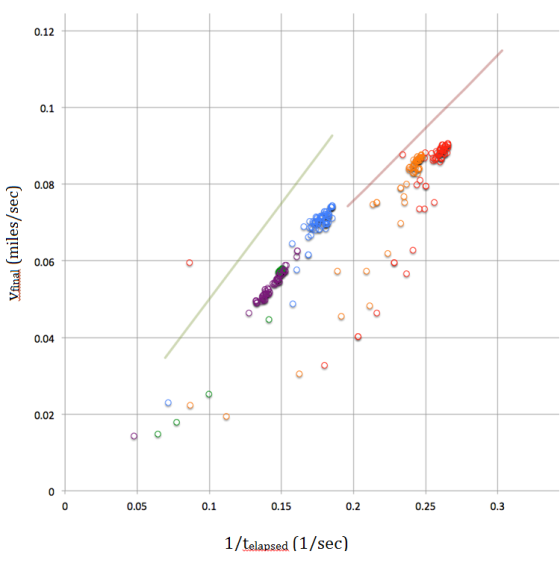
The above graph plots final velocity on the vertical axis and \frac{1}{elapsed\:time}1 e l a p s e d t i m e on the horizontal axis. It is easier to draw a Constant Acceleration Line (e.g., the two upwardly sloping lines) on this graph than it would be to draw a Constant Acceleration Line on a graph that used identical data, but had "elapsed time" on the horizontal axis, because:
A. Using
1elapsedtime gives you a straight Constant Acceleration
Line. Using Elapsed Time gives you a curved Constant Acceleration
Line.
B. Using Elapsed Time would cause some data points to be missing because they would be off of the scale of the chart
C. Using Elapsed Time produces a chart whose data points vary randomly, so no Constant Acceleration Line can be drawn which would describe their behavior.
Homework Answers
The data are varying with respect to time since no constant acceleration can be drawn on the plot. For solving these data regression method is used. Option C is correct.
Add Answer to:
The above graph plots final velocity on the vertical axis and
\frac{1}{elapsed\:time}1 e l a p...
1. Which graph best describes the "horizontal distance traveled" (vertical axis) versus the tim elapsed (horizontal...
 1. Which graph best describes the "horizontal distance traveled" (vertical axis) versus the tim elapsed (horizontal axis) for a car traveling at a constant speed of 60 miles per hour? Write down the letter and then justify your answer in a complete sentence Horizontal Position of Car (in miles) Answer: 240 Bapsed Time in hours) 120 2. (a) Sketch the speed in milòs per hour (mi/ h) versus time in hours for Problem #1. on - Speed of Car (miles...
on a distance/time graph...y axis being distance and x axis being time.....what would a vertical straight...
on a distance/time graph...y axis being distance and x axis being time.....what would a vertical straight line, up and down represent a. constant distance b. constant time, c constant speed, d. constant acceleration, or e. nothing is constant
on a distance/time graph...y axis being distance and x axis being time.....what would a straight line...
on a distance/time graph...y axis being distance and x axis being time.....what would a straight line , neither horizontal nor vertical represent (/) a. constant distance b. constant time, c constant speed, d. constant acceleration, or e. nothing is constant
In the given figure, the horizontal axis is the elapsed time with each box as 0.5...
 In the given figure, the horizontal axis is the elapsed time
with each box as 0.5 second. First, assume that the vertical axis
is the displacement x with each box representing 0.25
meters.
a) Figure out the displacement magnitude of instantaneous
velocity at point B.
b)In which region(s), if any does the object have negative Vx?
Why?
c) Calculate the average velocity Vx between points D and F.
Now, assume that the vertical axis shows the velocity
Vx, with each...
In the given figure, the horizontal axis is the elapsed time
with each box as 0.5 second. First, assume that the vertical axis
is the displacement x with each box representing 0.25
meters.
a) Figure out the displacement magnitude of instantaneous
velocity at point B.
b)In which region(s), if any does the object have negative Vx?
Why?
c) Calculate the average velocity Vx between points D and F.
Now, assume that the vertical axis shows the velocity
Vx, with each...
please graph this and answer the 2 questions below use the data above to plot a...
 please graph this and answer the 2 questions below
use the data above to plot a graph of light intensity
versus rate of photosynthesis.
etrum Graph of Spinach Chloroplast Extract 0.41 sle 1: Effect of Light Intensity on the Rate of Photosynthesis (Time should be in minutes, not minutes & seconds) Light Elapsed time Elapsed time Rate of Photosynthesis Intensity (minutes seconds) (minutes) ml. o (ml /hour) 45 watts 25 min 15 sec 25.25min 0.1 0.24 75 watts 14 min...
please graph this and answer the 2 questions below
use the data above to plot a graph of light intensity
versus rate of photosynthesis.
etrum Graph of Spinach Chloroplast Extract 0.41 sle 1: Effect of Light Intensity on the Rate of Photosynthesis (Time should be in minutes, not minutes & seconds) Light Elapsed time Elapsed time Rate of Photosynthesis Intensity (minutes seconds) (minutes) ml. o (ml /hour) 45 watts 25 min 15 sec 25.25min 0.1 0.24 75 watts 14 min...
In the graph of actual dragster data, most of the dots are below and to the...
 In the graph of actual dragster data, most of the dots are below
and to the right of the constant acceleration line. This is
because:
A. The dragster's acceleration was constant, causing its speed
to increase as time passed.
B. The dragster's acceleration increased as time passed.
C. The dragster's acceleration decreased as time passed.
D. The dragster's acceleration was constant, causing its speed
to decrease as time passed.
0.12 0.08 Oo Vfinal (miles/sec) 0.04 0.02 0 0.05 0.1 0.15...
In the graph of actual dragster data, most of the dots are below
and to the right of the constant acceleration line. This is
because:
A. The dragster's acceleration was constant, causing its speed
to increase as time passed.
B. The dragster's acceleration increased as time passed.
C. The dragster's acceleration decreased as time passed.
D. The dragster's acceleration was constant, causing its speed
to decrease as time passed.
0.12 0.08 Oo Vfinal (miles/sec) 0.04 0.02 0 0.05 0.1 0.15...
Refer to the following graph to answer the next five questions: Vertical Axis Horizontal Axis Assuming...
 Refer to the following graph to answer the next five questions: Vertical Axis Horizontal Axis Assuming the figure represents the market for loanable funds, it would be true that the vertical axis represents the interest rate, and the distance between points C and D represents the surplus of loanable funds at interest rate A. o line 1 represents the interest rate, and line 2 represents the quantity of savings. the vertical axis represents the quantity of funds lent and borrowed,...
need help on this graph Physies 195 - Straight-line kinematics Data: Dot period=1/10s: the time interval...
 need help on this graph
Physies 195 - Straight-line kinematics Data: Dot period=1/10s: the time interval between dots is 0.100 corrected values] 15 16 Xc (cm) te(s) 6 7 0 12 3 14. X(cm) t(s) đa (cm) | V (cm/s) 0 0 2.18 0.1002 .182 .0 4.890.200 12.7127.00 2. 5 0.30 3.67 36.70 12.88 o.quo 4.32 430 f 9.95 O S 10 .20 zich were 1 1 tbalo 30,56 38.0 74.50 46.43 0.900 8.8 84.43 55-25 88.00 1101.30 65.39 1.100...
need help on this graph
Physies 195 - Straight-line kinematics Data: Dot period=1/10s: the time interval between dots is 0.100 corrected values] 15 16 Xc (cm) te(s) 6 7 0 12 3 14. X(cm) t(s) đa (cm) | V (cm/s) 0 0 2.18 0.1002 .182 .0 4.890.200 12.7127.00 2. 5 0.30 3.67 36.70 12.88 o.quo 4.32 430 f 9.95 O S 10 .20 zich were 1 1 tbalo 30,56 38.0 74.50 46.43 0.900 8.8 84.43 55-25 88.00 1101.30 65.39 1.100...
The dependent variable is the position (y-axis) and the independent variable is the time (x-axis). This...
The dependent variable is the position (y-axis) and the independent variable is the time (x-axis). This is the measured position of a rock as it falls from the top of a very high cliff and obeys the equations y = 1/2gt2. Make sure you label the plot properly. Right click on a data point in the graph and add a “Trend line.” Select a polynomial of order 2. This is a parabolic equation and describes an object falling under constant...
2. Calculate the velocity at each time (except the first and the last one) by using values immedi...
 2. Calculate the velocity at each time (except the first and the last one) by using values immediately after and before those times: the tn-- For example, the velocity at point 2 is n Time t (s) Position x (m) Velocity v (m/s) vt (unit-mls) aGou .245 8 3,abus 1.553 3. calculate v/t (what are the units?) and write it in column 5 of the table above. Calculate its average and its uncertainty: Average uncertainty: 4. On the graph paper,...
 1. Which graph best describes the "horizontal distance traveled" (vertical axis) versus the tim elapsed (horizontal axis) for a car traveling at a constant speed of 60 miles per hour? Write down the letter and then justify your answer in a complete sentence Horizontal Position of Car (in miles) Answer: 240 Bapsed Time in hours) 120 2. (a) Sketch the speed in milòs per hour (mi/ h) versus time in hours for Problem #1. on - Speed of Car (miles...
 In the given figure, the horizontal axis is the elapsed time
with each box as 0.5 second. First, assume that the vertical axis
is the displacement x with each box representing 0.25
meters.
a) Figure out the displacement magnitude of instantaneous
velocity at point B.
b)In which region(s), if any does the object have negative Vx?
Why?
c) Calculate the average velocity Vx between points D and F.
Now, assume that the vertical axis shows the velocity
Vx, with each...
In the given figure, the horizontal axis is the elapsed time
with each box as 0.5 second. First, assume that the vertical axis
is the displacement x with each box representing 0.25
meters.
a) Figure out the displacement magnitude of instantaneous
velocity at point B.
b)In which region(s), if any does the object have negative Vx?
Why?
c) Calculate the average velocity Vx between points D and F.
Now, assume that the vertical axis shows the velocity
Vx, with each...
 please graph this and answer the 2 questions below
use the data above to plot a graph of light intensity
versus rate of photosynthesis.
etrum Graph of Spinach Chloroplast Extract 0.41 sle 1: Effect of Light Intensity on the Rate of Photosynthesis (Time should be in minutes, not minutes & seconds) Light Elapsed time Elapsed time Rate of Photosynthesis Intensity (minutes seconds) (minutes) ml. o (ml /hour) 45 watts 25 min 15 sec 25.25min 0.1 0.24 75 watts 14 min...
please graph this and answer the 2 questions below
use the data above to plot a graph of light intensity
versus rate of photosynthesis.
etrum Graph of Spinach Chloroplast Extract 0.41 sle 1: Effect of Light Intensity on the Rate of Photosynthesis (Time should be in minutes, not minutes & seconds) Light Elapsed time Elapsed time Rate of Photosynthesis Intensity (minutes seconds) (minutes) ml. o (ml /hour) 45 watts 25 min 15 sec 25.25min 0.1 0.24 75 watts 14 min...
 In the graph of actual dragster data, most of the dots are below
and to the right of the constant acceleration line. This is
because:
A. The dragster's acceleration was constant, causing its speed
to increase as time passed.
B. The dragster's acceleration increased as time passed.
C. The dragster's acceleration decreased as time passed.
D. The dragster's acceleration was constant, causing its speed
to decrease as time passed.
0.12 0.08 Oo Vfinal (miles/sec) 0.04 0.02 0 0.05 0.1 0.15...
In the graph of actual dragster data, most of the dots are below
and to the right of the constant acceleration line. This is
because:
A. The dragster's acceleration was constant, causing its speed
to increase as time passed.
B. The dragster's acceleration increased as time passed.
C. The dragster's acceleration decreased as time passed.
D. The dragster's acceleration was constant, causing its speed
to decrease as time passed.
0.12 0.08 Oo Vfinal (miles/sec) 0.04 0.02 0 0.05 0.1 0.15...
 Refer to the following graph to answer the next five questions: Vertical Axis Horizontal Axis Assuming the figure represents the market for loanable funds, it would be true that the vertical axis represents the interest rate, and the distance between points C and D represents the surplus of loanable funds at interest rate A. o line 1 represents the interest rate, and line 2 represents the quantity of savings. the vertical axis represents the quantity of funds lent and borrowed,...
 need help on this graph
Physies 195 - Straight-line kinematics Data: Dot period=1/10s: the time interval between dots is 0.100 corrected values] 15 16 Xc (cm) te(s) 6 7 0 12 3 14. X(cm) t(s) đa (cm) | V (cm/s) 0 0 2.18 0.1002 .182 .0 4.890.200 12.7127.00 2. 5 0.30 3.67 36.70 12.88 o.quo 4.32 430 f 9.95 O S 10 .20 zich were 1 1 tbalo 30,56 38.0 74.50 46.43 0.900 8.8 84.43 55-25 88.00 1101.30 65.39 1.100...
need help on this graph
Physies 195 - Straight-line kinematics Data: Dot period=1/10s: the time interval between dots is 0.100 corrected values] 15 16 Xc (cm) te(s) 6 7 0 12 3 14. X(cm) t(s) đa (cm) | V (cm/s) 0 0 2.18 0.1002 .182 .0 4.890.200 12.7127.00 2. 5 0.30 3.67 36.70 12.88 o.quo 4.32 430 f 9.95 O S 10 .20 zich were 1 1 tbalo 30,56 38.0 74.50 46.43 0.900 8.8 84.43 55-25 88.00 1101.30 65.39 1.100...
 2. Calculate the velocity at each time (except the first and the last one) by using values immediately after and before those times: the tn-- For example, the velocity at point 2 is n Time t (s) Position x (m) Velocity v (m/s) vt (unit-mls) aGou .245 8 3,abus 1.553 3. calculate v/t (what are the units?) and write it in column 5 of the table above. Calculate its average and its uncertainty: Average uncertainty: 4. On the graph paper,...
Most questions answered within 3 hours.
-
Where is the error in this code sequence?
String s1 = "Hello";
String s2 = "ello";...
asked 10 months ago -
Financial data for Joel de Paris, Inc., for last year
follow:
Joel de Paris, Inc.
Balance...
asked 10 months ago -
Consider this reaction:
Al2(SO4)3 (aq)+ BaCl3
(aq) Al2Cl6 (aq)- +
3BaSO4(s) . What is the...
asked 10 months ago -
Suppose that Savneet is considering increasing her
recent random sample from 20 car rentals to 40...
asked 10 months ago -
Trucks arrive at an unloading terminal at an average rate of 120
per hour.
Trucks arrive...
asked 10 months ago -
Why are methanol and ethanol completely soluble in water while
octanol is not very little soluble....
asked 10 months ago -
A facilities manager at a university reads in a research report
that the mean amount of...
asked 10 months ago -
When the CuSO4 is rehydrated by adding water to the anhydrous
compound, is this an endothermic...
asked 10 months ago -
A ray of sunlight is passing from diamond into crown glass; the
angle of incidence is...
asked 10 months ago -
A block of mass 0.249 kg is placed on top of a light, vertical
spring of...
asked 10 months ago -
how do the kidneys compensate in the presences of acidosis
a) trigger hyperventilate
b) reserve acid...
asked 10 months ago -
Question 501 pts
The rental rate of capital to the firm increases. Which of the
following...
asked 10 months ago