|
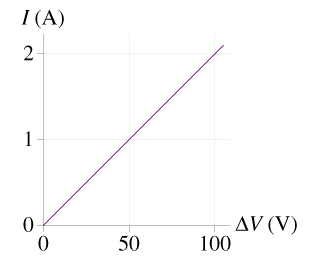
(Figure 1) is a current-versus-potential-difference graph for a cylinder.
What is the cylinder's resistance?
|
Part A What is the cylinder's resistance? |
Homework Answers

Add Answer to:
(Figure 1) is a current-versus-potential-difference graph for a
cylinder.
The plot shows the current as a...
The figure is a current-versus-potential-difference graph for a cylinder. What is the cylinder's resistance?
 The figure is a current-versus-potential-difference graph for a
cylinder.
What is the cylinder's resistance?
The figure is a current-versus-potential-difference graph for a
cylinder.
What is the cylinder's resistance?
The graph shows voltage difference versus current graph end-to-end across this cylindrical resistor: AV (V) 10...
 The graph shows voltage difference versus current graph end-to-end across this cylindrical resistor: AV (V) 10 87 A) What is the resistance? 24 OT 0 0.1 0.2 0.3 0.4 0.5 1(A B) If the resistor was split in half lengthwise as shown and similar data were collected, draw the new graph on the axes above.
The figure below represents a graph o the electric potential in ㅀ region o space versus...
 The figure below represents a graph o the electric potential in ㅀ region o space versus position x, where the electric ied is paralle to the x axis Fach vertical division on the graph is equal to 40 volts. x (cm) 0 23 4 (a) What is the electric field at 0.5 cm? Positive values represent electric fields in the +x direction. (b) what is the electric field at x = 2.5 cm? V/m (c) What is the electric field...
The figure shows a graph of electric potential V (in Volts) versus position x (in cm)....
 The figure shows a graph of electric potential V (in Volts) versus position x (in cm). If a proton (m = 1.67 x 10⁻²⁷ kg, q = 1.6 x 10⁻¹⁹ C) is released from rest from X;= 1.5 cm, its speed at Xp= 2.5 cm will be: V (V) 2 3 4 * (cm) O O m/s 15 m/s O 7.2 x 10⁶ m/s O 30 m/s 5.4 x 10⁴ m/s
The figure below shows a plot of potential energy U versus position x of a 1.04...
 The figure below shows a plot of potential energy U
versus position x of a 1.04 kg particle that can travel
only along an x axis. (Nonconservative forces are not
involved.) In the graphs, the potential energies are
U1 = 15 J, U2 = 30 J, and
U3 = 40 J.
The figure below shows a plot of potential energy U versus position x of a 1.04 kg particle that can travel only along an x axis. (Nonconservative forces are...
The figure below shows a plot of potential energy U
versus position x of a 1.04 kg particle that can travel
only along an x axis. (Nonconservative forces are not
involved.) In the graphs, the potential energies are
U1 = 15 J, U2 = 30 J, and
U3 = 40 J.
The figure below shows a plot of potential energy U versus position x of a 1.04 kg particle that can travel only along an x axis. (Nonconservative forces are...
The graph in Figure 1 shows the displacement versus position for the wave at t =...
 The graph in Figure 1 shows the displacement versus position for
the wave at t = 1:0 s. The graph in Figure 2 shows the displacement
versus time for the wave at x = 1:0 m. Determine the displacement
equation D(x,t) and the velocity of the wave. SHOW WORK
Plnti Plot: Figure 1: D(x) (m) vrs. r (m) Figure 2: D(t) (m) vrs. t (s) igure I: D(c) (m) vrs. m
The graph in Figure 1 shows the displacement versus position for
the wave at t = 1:0 s. The graph in Figure 2 shows the displacement
versus time for the wave at x = 1:0 m. Determine the displacement
equation D(x,t) and the velocity of the wave. SHOW WORK
Plnti Plot: Figure 1: D(x) (m) vrs. r (m) Figure 2: D(t) (m) vrs. t (s) igure I: D(c) (m) vrs. m
Question 7 The figure shows a plot of potential energy U versus position x of a...
 Question 7 The figure shows a plot of potential energy U versus position x of a 0.220 kg particle that can travel only along an x axis under the influence of a conservative force. The graph has these values: UA = 9.00 J, Uc = 20.0 J and UD-24.0 J. The particle is released at the point where U forms a "potential hiir of "height" UB-12.0J, with kinetic energy 5.00 J. What is the speed of the particle at (a)x...
The ideal battery in Figure (a) has emf = 9.0 V. Plot 1 in Figure (b) gives...
 The ideal battery in Figure (a) has emf =
9.0 V. Plot 1 in Figure (b) gives the electric potential
difference V that can appear across resistor 1 of the
circuit versus the current i in that resistor. The scale
of the V axis is set by Vs = 20.4 V,
and the scale of the i axis is set by
is = 3.31 mA. Plots 2 and 3 are similar plots
for resistors 2 and 3, respectively. What is the...
The ideal battery in Figure (a) has emf =
9.0 V. Plot 1 in Figure (b) gives the electric potential
difference V that can appear across resistor 1 of the
circuit versus the current i in that resistor. The scale
of the V axis is set by Vs = 20.4 V,
and the scale of the i axis is set by
is = 3.31 mA. Plots 2 and 3 are similar plots
for resistors 2 and 3, respectively. What is the...
Problem 2. The picture shows a graph of the electric potential in a region of space...
 Problem 2. The picture shows a graph of the electric potential in a region of space where the electric field is parallel to the x-axis. AV(x), Volts 200 a) Draw a graph of Ex versus x. 100 b) Label the maximum and minimum electric field on the y-axis of your graph (including units). .x, m 2 c) If an electron is placed at x = 4 m, what it would do? 3 4 5 6 7 8 -100H A. Stay...
The figure shows a plot of potential energy U versus position x of a 0.280 kg particle that can t...
 The figure shows a plot of potential energy U versus
position x of a 0.280 kg particle that can travel only
along an x axis under the influence of a conservative
force. The graph has these values: UA
= 9.00 J, UC = 20.0 J and
UD = 24.0 J. The particle is released
at the point where U forms a “potential hill” of “height”
UB = 12.0 J, with kinetic energy 5.00
J. What is the speed of the...
The figure shows a plot of potential energy U versus
position x of a 0.280 kg particle that can travel only
along an x axis under the influence of a conservative
force. The graph has these values: UA
= 9.00 J, UC = 20.0 J and
UD = 24.0 J. The particle is released
at the point where U forms a “potential hill” of “height”
UB = 12.0 J, with kinetic energy 5.00
J. What is the speed of the...
 The figure is a current-versus-potential-difference graph for a
cylinder.
What is the cylinder's resistance?
The figure is a current-versus-potential-difference graph for a
cylinder.
What is the cylinder's resistance?
 The graph shows voltage difference versus current graph end-to-end across this cylindrical resistor: AV (V) 10 87 A) What is the resistance? 24 OT 0 0.1 0.2 0.3 0.4 0.5 1(A B) If the resistor was split in half lengthwise as shown and similar data were collected, draw the new graph on the axes above.
 The figure below represents a graph o the electric potential in ㅀ region o space versus position x, where the electric ied is paralle to the x axis Fach vertical division on the graph is equal to 40 volts. x (cm) 0 23 4 (a) What is the electric field at 0.5 cm? Positive values represent electric fields in the +x direction. (b) what is the electric field at x = 2.5 cm? V/m (c) What is the electric field...
 The figure shows a graph of electric potential V (in Volts) versus position x (in cm). If a proton (m = 1.67 x 10⁻²⁷ kg, q = 1.6 x 10⁻¹⁹ C) is released from rest from X;= 1.5 cm, its speed at Xp= 2.5 cm will be: V (V) 2 3 4 * (cm) O O m/s 15 m/s O 7.2 x 10⁶ m/s O 30 m/s 5.4 x 10⁴ m/s
 The figure below shows a plot of potential energy U
versus position x of a 1.04 kg particle that can travel
only along an x axis. (Nonconservative forces are not
involved.) In the graphs, the potential energies are
U1 = 15 J, U2 = 30 J, and
U3 = 40 J.
The figure below shows a plot of potential energy U versus position x of a 1.04 kg particle that can travel only along an x axis. (Nonconservative forces are...
The figure below shows a plot of potential energy U
versus position x of a 1.04 kg particle that can travel
only along an x axis. (Nonconservative forces are not
involved.) In the graphs, the potential energies are
U1 = 15 J, U2 = 30 J, and
U3 = 40 J.
The figure below shows a plot of potential energy U versus position x of a 1.04 kg particle that can travel only along an x axis. (Nonconservative forces are...
 The graph in Figure 1 shows the displacement versus position for
the wave at t = 1:0 s. The graph in Figure 2 shows the displacement
versus time for the wave at x = 1:0 m. Determine the displacement
equation D(x,t) and the velocity of the wave. SHOW WORK
Plnti Plot: Figure 1: D(x) (m) vrs. r (m) Figure 2: D(t) (m) vrs. t (s) igure I: D(c) (m) vrs. m
The graph in Figure 1 shows the displacement versus position for
the wave at t = 1:0 s. The graph in Figure 2 shows the displacement
versus time for the wave at x = 1:0 m. Determine the displacement
equation D(x,t) and the velocity of the wave. SHOW WORK
Plnti Plot: Figure 1: D(x) (m) vrs. r (m) Figure 2: D(t) (m) vrs. t (s) igure I: D(c) (m) vrs. m
 Question 7 The figure shows a plot of potential energy U versus position x of a 0.220 kg particle that can travel only along an x axis under the influence of a conservative force. The graph has these values: UA = 9.00 J, Uc = 20.0 J and UD-24.0 J. The particle is released at the point where U forms a "potential hiir of "height" UB-12.0J, with kinetic energy 5.00 J. What is the speed of the particle at (a)x...
 The ideal battery in Figure (a) has emf =
9.0 V. Plot 1 in Figure (b) gives the electric potential
difference V that can appear across resistor 1 of the
circuit versus the current i in that resistor. The scale
of the V axis is set by Vs = 20.4 V,
and the scale of the i axis is set by
is = 3.31 mA. Plots 2 and 3 are similar plots
for resistors 2 and 3, respectively. What is the...
The ideal battery in Figure (a) has emf =
9.0 V. Plot 1 in Figure (b) gives the electric potential
difference V that can appear across resistor 1 of the
circuit versus the current i in that resistor. The scale
of the V axis is set by Vs = 20.4 V,
and the scale of the i axis is set by
is = 3.31 mA. Plots 2 and 3 are similar plots
for resistors 2 and 3, respectively. What is the...
 Problem 2. The picture shows a graph of the electric potential in a region of space where the electric field is parallel to the x-axis. AV(x), Volts 200 a) Draw a graph of Ex versus x. 100 b) Label the maximum and minimum electric field on the y-axis of your graph (including units). .x, m 2 c) If an electron is placed at x = 4 m, what it would do? 3 4 5 6 7 8 -100H A. Stay...
 The figure shows a plot of potential energy U versus
position x of a 0.280 kg particle that can travel only
along an x axis under the influence of a conservative
force. The graph has these values: UA
= 9.00 J, UC = 20.0 J and
UD = 24.0 J. The particle is released
at the point where U forms a “potential hill” of “height”
UB = 12.0 J, with kinetic energy 5.00
J. What is the speed of the...
The figure shows a plot of potential energy U versus
position x of a 0.280 kg particle that can travel only
along an x axis under the influence of a conservative
force. The graph has these values: UA
= 9.00 J, UC = 20.0 J and
UD = 24.0 J. The particle is released
at the point where U forms a “potential hill” of “height”
UB = 12.0 J, with kinetic energy 5.00
J. What is the speed of the...
Most questions answered within 3 hours.
-
Where is the error in this code sequence?
String s1 = "Hello";
String s2 = "ello";...
asked 10 months ago -
Financial data for Joel de Paris, Inc., for last year
follow:
Joel de Paris, Inc.
Balance...
asked 10 months ago -
Consider this reaction:
Al2(SO4)3 (aq)+ BaCl3
(aq) Al2Cl6 (aq)- +
3BaSO4(s) . What is the...
asked 10 months ago -
Suppose that Savneet is considering increasing her
recent random sample from 20 car rentals to 40...
asked 10 months ago -
Trucks arrive at an unloading terminal at an average rate of 120
per hour.
Trucks arrive...
asked 10 months ago -
Why are methanol and ethanol completely soluble in water while
octanol is not very little soluble....
asked 10 months ago -
A facilities manager at a university reads in a research report
that the mean amount of...
asked 10 months ago -
When the CuSO4 is rehydrated by adding water to the anhydrous
compound, is this an endothermic...
asked 10 months ago -
A ray of sunlight is passing from diamond into crown glass; the
angle of incidence is...
asked 10 months ago -
A block of mass 0.249 kg is placed on top of a light, vertical
spring of...
asked 10 months ago -
how do the kidneys compensate in the presences of acidosis
a) trigger hyperventilate
b) reserve acid...
asked 10 months ago -
Question 501 pts
The rental rate of capital to the firm increases. Which of the
following...
asked 10 months ago