
Homework Answers
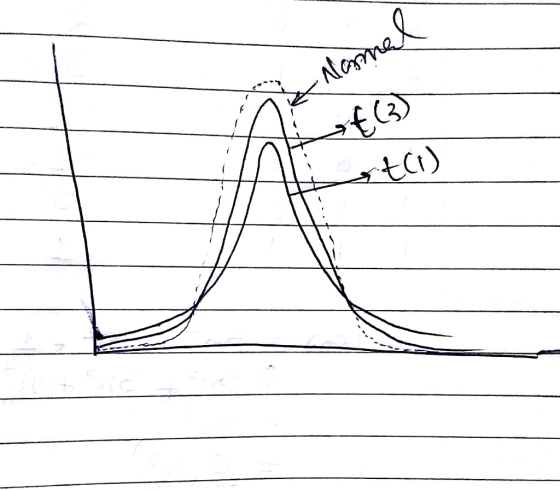
1. Dotted line represents standard normal distribution
Solid line represents t distribution with degree of freedom 3.
B)
Add Answer to:
Below are the graphs of a standard Normal distribution and a t-distribution with 3 degrees of...
PLEASE PUT CLEAR AND EASY TO READ RESPONSES! THANK YOU! 1. Below are the graphs of...
 PLEASE PUT CLEAR AND EASY TO READ RESPONSES!
THANK YOU!
1. Below are the graphs of a standard Normal distribution and a t-distribution with 3 degrees of freedom. (a) Indicated which graph is which and explain how you know. Dotted graph Solid graph- 3-2 1 (b) On the same figure sketch a graph of a t-distribution with 1 degree of freedom. 2. Find the critical value for each of the following confidence intervals: (a) 95% confidence interval with 8 degrees...
PLEASE PUT CLEAR AND EASY TO READ RESPONSES!
THANK YOU!
1. Below are the graphs of a standard Normal distribution and a t-distribution with 3 degrees of freedom. (a) Indicated which graph is which and explain how you know. Dotted graph Solid graph- 3-2 1 (b) On the same figure sketch a graph of a t-distribution with 1 degree of freedom. 2. Find the critical value for each of the following confidence intervals: (a) 95% confidence interval with 8 degrees...
The figure on the right shows three unimodal and symmetric curves: the standard normal (z) distribution,...
 The figure on the right shows three unimodal and symmetric curves: the standard normal (z) distribution, the t-distribution with 5 degrees of freedom, and the t-distribution with 1 degree of freedom. Determine which is which, and explain your reasoning.
1) The t-distribution converges to the standard normal distribution as degrees of freedom increase. True or...
1) The t-distribution converges to the standard normal distribution as degrees of freedom increase. True or False? 2) What do we call the hypothesis that is accepted by default unless the contradictory evidence in overwhelmingly convincing?
One graph in the figure represents a normal distribution with mean 4 = 10 and standard...
 One graph in the figure represents a normal distribution with mean 4 = 10 and standard deviation 0 = 3. The other graph represents a normal distribution with mean y = 10 and standard deviation o =2. Determine which graph is which and explain how you know.
2. (Graphs, degree sequence) If G is a simple graph with n vertices, then the degree...
2. (Graphs, degree sequence) If G is a simple graph with n vertices, then the degree sequence of G is a list a1, a2, a3, . . . , an of the degrees of all of the vertices of G in decreasing order. For instance, the degree sequence of the graph G drawn here is 3, 2, 2, 2, 2, 2, 1, 0. (a) Sketch a graph with the degree sequence 4, 3, 2, 2, 2, 1, and a graph...
QUESTION 5 Which statement concerning the t-distribution is false? O AT follows a standard normal distribution...
 QUESTION 5 Which statement concerning the t-distribution is false? O AT follows a standard normal distribution OB. The smaller the degrees of freedom the flatter the curve. OC. The t-distribution has a larger standard deviation than the Standard Normal Curve. OD. T-distributions have a mean of 0. o E. The total area under the density curve depends on the degrees of freedom. QUESTION 6 The t-procedures are robust when A. sample size is 12 and the sample data is not...
T or F? The student's-t distribution tends toward the Normal distribution with large degrees of freedom.
T or F? The student's-t distribution tends toward the Normal distribution with large degrees of freedom.
The difference between the T distribution and the standard normal (z) distribution decreases as the degrees...
The difference between the T distribution and the standard normal (z) distribution decreases as the degrees of freedom increase. True False When estimating the number of responses to be collected in order to achieve a desired margin of error on a proportion, what value should be used for the population proportion if no estimate is available? Enter your answer as a decimal to 2 decimal places. A population is believed to have a standard deviation of 23.1. An analyst wants...
Prove that if random variable X follows a standard normal distribution (with mean u= 0 and...
 Prove that if random variable X follows a standard normal distribution (with mean u= 0 and standard deviation o = 1), then Y = X2 follows a chi-square distribution with 1 degree of freedom. In particular, show that My(t) = Mx2(t) = E[etX?), which equals the moment generating function of a chi-square distribution with 1 degree of freedom.
The t-distribution and the standard normal distribution diverge(become very different) as the degree of freedom become...
The t-distribution and the standard normal distribution diverge(become very different) as the degree of freedom become very large( that is,approach infinity). true or false
 PLEASE PUT CLEAR AND EASY TO READ RESPONSES!
THANK YOU!
1. Below are the graphs of a standard Normal distribution and a t-distribution with 3 degrees of freedom. (a) Indicated which graph is which and explain how you know. Dotted graph Solid graph- 3-2 1 (b) On the same figure sketch a graph of a t-distribution with 1 degree of freedom. 2. Find the critical value for each of the following confidence intervals: (a) 95% confidence interval with 8 degrees...
PLEASE PUT CLEAR AND EASY TO READ RESPONSES!
THANK YOU!
1. Below are the graphs of a standard Normal distribution and a t-distribution with 3 degrees of freedom. (a) Indicated which graph is which and explain how you know. Dotted graph Solid graph- 3-2 1 (b) On the same figure sketch a graph of a t-distribution with 1 degree of freedom. 2. Find the critical value for each of the following confidence intervals: (a) 95% confidence interval with 8 degrees...
 The figure on the right shows three unimodal and symmetric curves: the standard normal (z) distribution, the t-distribution with 5 degrees of freedom, and the t-distribution with 1 degree of freedom. Determine which is which, and explain your reasoning.
 One graph in the figure represents a normal distribution with mean 4 = 10 and standard deviation 0 = 3. The other graph represents a normal distribution with mean y = 10 and standard deviation o =2. Determine which graph is which and explain how you know.
 QUESTION 5 Which statement concerning the t-distribution is false? O AT follows a standard normal distribution OB. The smaller the degrees of freedom the flatter the curve. OC. The t-distribution has a larger standard deviation than the Standard Normal Curve. OD. T-distributions have a mean of 0. o E. The total area under the density curve depends on the degrees of freedom. QUESTION 6 The t-procedures are robust when A. sample size is 12 and the sample data is not...
 Prove that if random variable X follows a standard normal distribution (with mean u= 0 and standard deviation o = 1), then Y = X2 follows a chi-square distribution with 1 degree of freedom. In particular, show that My(t) = Mx2(t) = E[etX?), which equals the moment generating function of a chi-square distribution with 1 degree of freedom.
Most questions answered within 3 hours.
-
Where is the error in this code sequence?
String s1 = "Hello";
String s2 = "ello";...
asked 10 months ago -
Financial data for Joel de Paris, Inc., for last year
follow:
Joel de Paris, Inc.
Balance...
asked 10 months ago -
Consider this reaction:
Al2(SO4)3 (aq)+ BaCl3
(aq) Al2Cl6 (aq)- +
3BaSO4(s) . What is the...
asked 10 months ago -
Suppose that Savneet is considering increasing her
recent random sample from 20 car rentals to 40...
asked 10 months ago -
Trucks arrive at an unloading terminal at an average rate of 120
per hour.
Trucks arrive...
asked 10 months ago -
Why are methanol and ethanol completely soluble in water while
octanol is not very little soluble....
asked 10 months ago -
A facilities manager at a university reads in a research report
that the mean amount of...
asked 10 months ago -
When the CuSO4 is rehydrated by adding water to the anhydrous
compound, is this an endothermic...
asked 10 months ago -
A ray of sunlight is passing from diamond into crown glass; the
angle of incidence is...
asked 10 months ago -
A block of mass 0.249 kg is placed on top of a light, vertical
spring of...
asked 10 months ago -
how do the kidneys compensate in the presences of acidosis
a) trigger hyperventilate
b) reserve acid...
asked 10 months ago -
Question 501 pts
The rental rate of capital to the firm increases. Which of the
following...
asked 10 months ago