

Homework Answers
If the price of hamburgers increase, then the demand for hotdogs increase as both are substitutes and this creates or shifts the demand curve to the right
Add Answer to:
LENGAGE MINDTAP Homework: Supply and Der Q Search this c Theory (Ch 03) 6. Shifts in...
Search this cous Homework (Ch 04) 5. Shifts in supply or demand I The following graph...
 Search this cous Homework (Ch 04) 5. Shifts in supply or demand I The following graph shows the market for cereal in Houston, where there are over 1,000 stores that sell cereal at any given moment. Suppose the Surgeon General issues a public statement saying that consuming cereal is good for your health. Show the effect of this change on the market for cereal by shifting one or both of the curves on the following graph, holding all else constant....
9. Shifts in supply or demand II The following graph shows the market for hot dogs...
 9. Shifts in supply or demand II The following graph shows the market for hot dogs in Philadelphia, where there are over 1,000 hot dog stands at any given moment. Suppose the number of hot dog stands increases significantly. Show the effect of this change on the market for hot dogs by shifting one or both of the curves on the following graph, holding all else constant.
The following graph shows the market for hot dogs in Houston, where there are over 1,000...
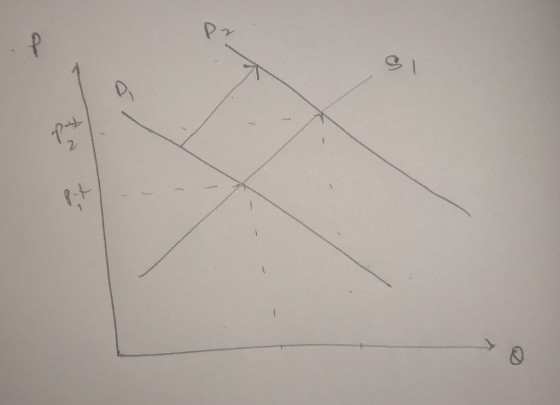
 The following graph shows the market for hot dogs in Houston, where there are over 1,000 hot dog stands at any given moment. Suppose the price of hamburgers increases. (Assume that people regard hot dogs and hamburgers as substitutes.) Show the effect of this change on the market for hot dogs by shifting one or both of the curves on the following graph, holding all else constant.If hot dogs are a normal good, this will cause the demand for hot dogs...
CENGAGE | MINDTAP Aplia Homework: Monopoly 5. Monopoly outcome versus competition outcome Consider the daily market...
 CENGAGE | MINDTAP Aplia Homework: Monopoly 5. Monopoly outcome versus competition outcome Consider the daily market for hot dogs in a small city. Suppose that this market is in long-run competitive equilibrium, with many hot dog stands in the city, each one selling the same kind of hot dogs. Therefore, each vendor is a price taker and possesses no market power. The following graph shows the demand (D) and supply curves (S - MC) in the market for hot dogs....
ng.cengage.com MindTapCengage Learning CENGAGE | MINDTAP Homework (Ch 05) Back to Assignment Attempts: 0 Keep the...
 ng.cengage.com MindTapCengage Learning CENGAGE | MINDTAP Homework (Ch 05) Back to Assignment Attempts: 0 Keep the Highest: 0/4 6. Elasticity and total revenue The following graph shows the daily demand curve for bikes in Denver Use the green rectangle (triangle symbols) to compute total revenue at various prions along the demand curve. Note: You will not be graded on any changes made to this graph. Total Revenue CE (Dollars per bike) ng cengage.com 2020 ECO27200) CENGAGE | MINDTAP Q Search...
7. Movements along versus shifts of supply curves Consider the market supply of...
 1)7. Movements along versus shifts of supply curvesConsider the market supply of peanut butter.Complete the following table by indicating whether an event will cause a movement along the supply curve for peanut butter or a shift of the supply curve for peanut butter, holding all else constant.EventMovement AlongShiftA change in expectations about the future price of peanut butterA decrease in the price of peanut butterA change in technology that makes it less costly to produce peanut butter2)9. Shifts in supply...
9. Shifts in supply or demand II The following graph shows the market for...
 1)9. Shifts in supply or demand IIThe following graph shows the market for cakes in Miami, where there are over 1,000 bakeries at any given moment. Suppose the price of flour, a major ingredient in cakes, suddenly increases.Show the effect of this change on the market for cakes by shifting one or both of the curves on the following graph, holding all else constant.2)10. Market equilibriumThe following table shows the annual demand and supply in the market for shoes in...
Homework (Ch 15) Consider the daily market for hot dogs in a small city. Suppose that...
 Homework (Ch 15) Consider the daily market for hot dogs in a small city. Suppose that this market is in long-run competitive equilibrium with many hot dog stands in the city, each one selling the same kind of hot dogs. Therefore, each vendor is a price taker and possesses no market power MC) curves in the market for hot dogs The following graph shows the demand (D) and supply (S Place the black point (plus symbol) on the graph to...
computing real exchange rates CENGAGE MINDTAP MindTap - Cengage Learning Homework (Ch 18) Q Search this...
 computing real exchange rates
CENGAGE MINDTAP MindTap - Cengage Learning Homework (Ch 18) Q Search this < Back to Assignment Attempts: Average: Average: 11 1 7. Computing real exchange rates Consider a basket of consumer goods that costs $80 in the United States. The same basket of goods costs GHS 24 in Ghana Holding constant the cost of the basket in each country, compute the real exchange rates that would result from the two nominal exchange rates in the following...
computing real exchange rates
CENGAGE MINDTAP MindTap - Cengage Learning Homework (Ch 18) Q Search this < Back to Assignment Attempts: Average: Average: 11 1 7. Computing real exchange rates Consider a basket of consumer goods that costs $80 in the United States. The same basket of goods costs GHS 24 in Ghana Holding constant the cost of the basket in each country, compute the real exchange rates that would result from the two nominal exchange rates in the following...
Homework (Ch 04) 13. How shifts in demand and supply affect equilibrium Consider the market for...
 Homework (Ch 04) 13. How shifts in demand and supply affect equilibrium Consider the market for pens. Suppose that the number of students with an allergy to pencil erasers increases, causing more students to switch from pendils to pens in school. Moreover, the price of plastic, an important input in pen production, has dropped considerably. On the folowing graph, labeled Scenario 1, indicate the effect these two events have on the demand for and supply of pens. 3 Scenario 1...
 Search this cous Homework (Ch 04) 5. Shifts in supply or demand I The following graph shows the market for cereal in Houston, where there are over 1,000 stores that sell cereal at any given moment. Suppose the Surgeon General issues a public statement saying that consuming cereal is good for your health. Show the effect of this change on the market for cereal by shifting one or both of the curves on the following graph, holding all else constant....
 CENGAGE | MINDTAP Aplia Homework: Monopoly 5. Monopoly outcome versus competition outcome Consider the daily market for hot dogs in a small city. Suppose that this market is in long-run competitive equilibrium, with many hot dog stands in the city, each one selling the same kind of hot dogs. Therefore, each vendor is a price taker and possesses no market power. The following graph shows the demand (D) and supply curves (S - MC) in the market for hot dogs....
 ng.cengage.com MindTapCengage Learning CENGAGE | MINDTAP Homework (Ch 05) Back to Assignment Attempts: 0 Keep the Highest: 0/4 6. Elasticity and total revenue The following graph shows the daily demand curve for bikes in Denver Use the green rectangle (triangle symbols) to compute total revenue at various prions along the demand curve. Note: You will not be graded on any changes made to this graph. Total Revenue CE (Dollars per bike) ng cengage.com 2020 ECO27200) CENGAGE | MINDTAP Q Search...
 1)7. Movements along versus shifts of supply curvesConsider the market supply of peanut butter.Complete the following table by indicating whether an event will cause a movement along the supply curve for peanut butter or a shift of the supply curve for peanut butter, holding all else constant.EventMovement AlongShiftA change in expectations about the future price of peanut butterA decrease in the price of peanut butterA change in technology that makes it less costly to produce peanut butter2)9. Shifts in supply...
 Homework (Ch 15) Consider the daily market for hot dogs in a small city. Suppose that this market is in long-run competitive equilibrium with many hot dog stands in the city, each one selling the same kind of hot dogs. Therefore, each vendor is a price taker and possesses no market power MC) curves in the market for hot dogs The following graph shows the demand (D) and supply (S Place the black point (plus symbol) on the graph to...
 computing real exchange rates
CENGAGE MINDTAP MindTap - Cengage Learning Homework (Ch 18) Q Search this < Back to Assignment Attempts: Average: Average: 11 1 7. Computing real exchange rates Consider a basket of consumer goods that costs $80 in the United States. The same basket of goods costs GHS 24 in Ghana Holding constant the cost of the basket in each country, compute the real exchange rates that would result from the two nominal exchange rates in the following...
computing real exchange rates
CENGAGE MINDTAP MindTap - Cengage Learning Homework (Ch 18) Q Search this < Back to Assignment Attempts: Average: Average: 11 1 7. Computing real exchange rates Consider a basket of consumer goods that costs $80 in the United States. The same basket of goods costs GHS 24 in Ghana Holding constant the cost of the basket in each country, compute the real exchange rates that would result from the two nominal exchange rates in the following...
 Homework (Ch 04) 13. How shifts in demand and supply affect equilibrium Consider the market for pens. Suppose that the number of students with an allergy to pencil erasers increases, causing more students to switch from pendils to pens in school. Moreover, the price of plastic, an important input in pen production, has dropped considerably. On the folowing graph, labeled Scenario 1, indicate the effect these two events have on the demand for and supply of pens. 3 Scenario 1...
Most questions answered within 3 hours.
-
Where is the error in this code sequence?
String s1 = "Hello";
String s2 = "ello";...
asked 10 months ago -
Financial data for Joel de Paris, Inc., for last year
follow:
Joel de Paris, Inc.
Balance...
asked 10 months ago -
Consider this reaction:
Al2(SO4)3 (aq)+ BaCl3
(aq) Al2Cl6 (aq)- +
3BaSO4(s) . What is the...
asked 10 months ago -
Suppose that Savneet is considering increasing her
recent random sample from 20 car rentals to 40...
asked 10 months ago -
Trucks arrive at an unloading terminal at an average rate of 120
per hour.
Trucks arrive...
asked 10 months ago -
Why are methanol and ethanol completely soluble in water while
octanol is not very little soluble....
asked 10 months ago -
A facilities manager at a university reads in a research report
that the mean amount of...
asked 10 months ago -
When the CuSO4 is rehydrated by adding water to the anhydrous
compound, is this an endothermic...
asked 10 months ago -
A ray of sunlight is passing from diamond into crown glass; the
angle of incidence is...
asked 10 months ago -
A block of mass 0.249 kg is placed on top of a light, vertical
spring of...
asked 10 months ago -
how do the kidneys compensate in the presences of acidosis
a) trigger hyperventilate
b) reserve acid...
asked 10 months ago -
Question 501 pts
The rental rate of capital to the firm increases. Which of the
following...
asked 10 months ago