![Question 1 : [9] (1) Choose a point (A or B or C)[1] (2) Choose a point (A or B or C)[1] (3) Choose a point (A or B or C)[1].](http://img.homeworklib.com/questions/3e625bd0-7591-11ea-b20d-05969589f79f.png?x-oss-process=image/resize,w_560)

Homework Answers
Add Answer to:
please help with question one
Question 1 : [9] (1) Choose a point (A or B...
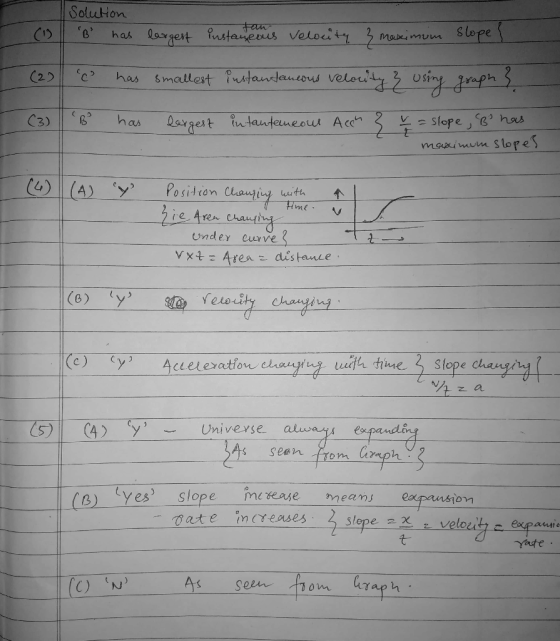
Figure (b) shows the size vs. age graph of our universe. One can consider it as...
 Figure (b) shows the size vs. age graph of our universe. One can
consider it as an x-t graph and read from it the expansion rate of
the universe (velocity) and how the rate changes with time
(acceleration). Are the statements below correct? (And explain)
A. The universe is always expanding.
B. 10 billion years ago, the expansion rate of the universe was
increasing.
C. The universe will be expanding slower 10 billion years later
than it is now.
(3B...
Figure (b) shows the size vs. age graph of our universe. One can
consider it as an x-t graph and read from it the expansion rate of
the universe (velocity) and how the rate changes with time
(acceleration). Are the statements below correct? (And explain)
A. The universe is always expanding.
B. 10 billion years ago, the expansion rate of the universe was
increasing.
C. The universe will be expanding slower 10 billion years later
than it is now.
(3B...
Time 0 A B C Time-1 billion years Time 2 billion years Distance scale in Mpc 6. [5pt] The picture above shows a simple one-dimensional model for an expanding universe. The points labled A, B and C ar...
 Time 0 A B C Time-1 billion years Time 2 billion years Distance scale in Mpc 6. [5pt] The picture above shows a simple one-dimensional model for an expanding universe. The points labled A, B and C are locations of galaxies in this universe. Each line shows the universe after a time of 1 billion years has passed. The drawings are made to the scale given in the figure. Use the drawing and the fact that speed is distance divided...
Answer these questions please 07 1 point Two children, Joan and Mike, start at one end...
 Answer these questions please
07 1 point Two children, Joan and Mike, start at one end of a street. They run to the right until they reach the other end, then they head back to the starting point. On the way back, Joan is ahead of Mike. Which statement is correct about the distances run and the displacements from the origin? * Joan has run a greater distance and her displacement is greater than Mike's. Mike has run a greater...
Answer these questions please
07 1 point Two children, Joan and Mike, start at one end of a street. They run to the right until they reach the other end, then they head back to the starting point. On the way back, Joan is ahead of Mike. Which statement is correct about the distances run and the displacements from the origin? * Joan has run a greater distance and her displacement is greater than Mike's. Mike has run a greater...
Answer both questions please Question 13 0/ 1 point If we are given a graph which...
 Answer both questions please
Question 13 0/ 1 point If we are given a graph which shows a plot of the position as a function of time, xt), how will the instantaneous yelocity at point C be related to the graph? A) it would equal the slope of the line tangent to the x(t) curve at point B B) it would equal the slope of the line tangent to the x(t) curve at point C C) it would equal the...
Answer both questions please
Question 13 0/ 1 point If we are given a graph which shows a plot of the position as a function of time, xt), how will the instantaneous yelocity at point C be related to the graph? A) it would equal the slope of the line tangent to the x(t) curve at point B B) it would equal the slope of the line tangent to the x(t) curve at point C C) it would equal the...
69. Th e velocity-time graph in Figure 7 shows change in velocity for a truck,(1.1) Velocity...
 69. Th e velocity-time graph in Figure 7 shows change in velocity for a truck,(1.1) Velocity v. Time 77. The C the St 98 m horiz initia ct 25 1 20 15 E 10 78. For ce foll sou as an 24 10 t (s) Figure 7 (a) At what point is the instantaneous velocity o truck equal to the average velocity? (b) Determine the magnitude of the acceleratiom the truck from the graph in Figure 7. 70, A race...
need help on this graph Physies 195 - Straight-line kinematics Data: Dot period=1/10s: the time interval...
 need help on this graph
Physies 195 - Straight-line kinematics Data: Dot period=1/10s: the time interval between dots is 0.100 corrected values] 15 16 Xc (cm) te(s) 6 7 0 12 3 14. X(cm) t(s) đa (cm) | V (cm/s) 0 0 2.18 0.1002 .182 .0 4.890.200 12.7127.00 2. 5 0.30 3.67 36.70 12.88 o.quo 4.32 430 f 9.95 O S 10 .20 zich were 1 1 tbalo 30,56 38.0 74.50 46.43 0.900 8.8 84.43 55-25 88.00 1101.30 65.39 1.100...
need help on this graph
Physies 195 - Straight-line kinematics Data: Dot period=1/10s: the time interval between dots is 0.100 corrected values] 15 16 Xc (cm) te(s) 6 7 0 12 3 14. X(cm) t(s) đa (cm) | V (cm/s) 0 0 2.18 0.1002 .182 .0 4.890.200 12.7127.00 2. 5 0.30 3.67 36.70 12.88 o.quo 4.32 430 f 9.95 O S 10 .20 zich were 1 1 tbalo 30,56 38.0 74.50 46.43 0.900 8.8 84.43 55-25 88.00 1101.30 65.39 1.100...
Please show all your work. 5) Acceleration is to velocity as velocity is to position . aaux"# r where vr įs th...
 Please show all your work.
5) Acceleration is to velocity as velocity is to position . aaux"# r where vr įs the instantaneous velocity. So the average acceleration is about how rapidly the instantaneous velocity is changing, and the sign tells about the direction of the change. At For the pendulum, you made estimates of the instantaneous velocity for ←2.05[s] and t= 2.5%]. Also, the average speed and average velocity estimates that you made at other times may be reasonable...
Please show all your work.
5) Acceleration is to velocity as velocity is to position . aaux"# r where vr įs the instantaneous velocity. So the average acceleration is about how rapidly the instantaneous velocity is changing, and the sign tells about the direction of the change. At For the pendulum, you made estimates of the instantaneous velocity for ←2.05[s] and t= 2.5%]. Also, the average speed and average velocity estimates that you made at other times may be reasonable...
1. Which of the following equations are dimensionally correct? a.) V = V1 + ax (10p)...
 1. Which of the following equations are dimensionally correct? a.) V = V1 + ax (10p) b.) y = (2m)cos(kx), where k = 2m-1 (10p) 2. Given the vectors A = 2.001 + 6.00j andB = 3.00i + 2.00j. a.) draw the vector sum C = A + B and the vector differenceD = A - B. (10p) b.) Calculate C and D, first in terms of unit vectors and then in terms of polar coordinates, with angles measured with...
hello, I need help with this for a homework problem soon. this is just one question...
 hello,
I need help with this for a homework problem soon. this is
just one question with multiple parts i'd greatly appreciate
it.
a) (5 pts) During free fall, after some object has been thrown upwards, the velocity momentarily goes to zero at the highest point in the trajectory. Some people (falsely) believe that the acceleration of the object also becomes zero at the highest point in the trajectory. Briefly explain what the motion of the object would look like...
hello,
I need help with this for a homework problem soon. this is
just one question with multiple parts i'd greatly appreciate
it.
a) (5 pts) During free fall, after some object has been thrown upwards, the velocity momentarily goes to zero at the highest point in the trajectory. Some people (falsely) believe that the acceleration of the object also becomes zero at the highest point in the trajectory. Briefly explain what the motion of the object would look like...
h gr f j b k a Time t Select the point(s) on graph from options that has negative acceleration (Select all that app...
 h gr f j b k a Time t Select the point(s) on graph from options that has negative acceleration (Select all that apply). ( take the reference of above t vs v graph) k b f h Velocity
h gr f j b k a Time t Select the point(s) on graph from options that has negative acceleration (Select all that apply). ( take the reference of above t vs v graph) k b f h Velocity
h gr f j b k a Time t Select the point(s) on graph from options that has negative acceleration (Select all that apply). ( take the reference of above t vs v graph) k b f h Velocity
 Figure (b) shows the size vs. age graph of our universe. One can
consider it as an x-t graph and read from it the expansion rate of
the universe (velocity) and how the rate changes with time
(acceleration). Are the statements below correct? (And explain)
A. The universe is always expanding.
B. 10 billion years ago, the expansion rate of the universe was
increasing.
C. The universe will be expanding slower 10 billion years later
than it is now.
(3B...
Figure (b) shows the size vs. age graph of our universe. One can
consider it as an x-t graph and read from it the expansion rate of
the universe (velocity) and how the rate changes with time
(acceleration). Are the statements below correct? (And explain)
A. The universe is always expanding.
B. 10 billion years ago, the expansion rate of the universe was
increasing.
C. The universe will be expanding slower 10 billion years later
than it is now.
(3B...
 Time 0 A B C Time-1 billion years Time 2 billion years Distance scale in Mpc 6. [5pt] The picture above shows a simple one-dimensional model for an expanding universe. The points labled A, B and C are locations of galaxies in this universe. Each line shows the universe after a time of 1 billion years has passed. The drawings are made to the scale given in the figure. Use the drawing and the fact that speed is distance divided...
 Answer these questions please
07 1 point Two children, Joan and Mike, start at one end of a street. They run to the right until they reach the other end, then they head back to the starting point. On the way back, Joan is ahead of Mike. Which statement is correct about the distances run and the displacements from the origin? * Joan has run a greater distance and her displacement is greater than Mike's. Mike has run a greater...
Answer these questions please
07 1 point Two children, Joan and Mike, start at one end of a street. They run to the right until they reach the other end, then they head back to the starting point. On the way back, Joan is ahead of Mike. Which statement is correct about the distances run and the displacements from the origin? * Joan has run a greater distance and her displacement is greater than Mike's. Mike has run a greater...
 Answer both questions please
Question 13 0/ 1 point If we are given a graph which shows a plot of the position as a function of time, xt), how will the instantaneous yelocity at point C be related to the graph? A) it would equal the slope of the line tangent to the x(t) curve at point B B) it would equal the slope of the line tangent to the x(t) curve at point C C) it would equal the...
Answer both questions please
Question 13 0/ 1 point If we are given a graph which shows a plot of the position as a function of time, xt), how will the instantaneous yelocity at point C be related to the graph? A) it would equal the slope of the line tangent to the x(t) curve at point B B) it would equal the slope of the line tangent to the x(t) curve at point C C) it would equal the...
 69. Th e velocity-time graph in Figure 7 shows change in velocity for a truck,(1.1) Velocity v. Time 77. The C the St 98 m horiz initia ct 25 1 20 15 E 10 78. For ce foll sou as an 24 10 t (s) Figure 7 (a) At what point is the instantaneous velocity o truck equal to the average velocity? (b) Determine the magnitude of the acceleratiom the truck from the graph in Figure 7. 70, A race...
 need help on this graph
Physies 195 - Straight-line kinematics Data: Dot period=1/10s: the time interval between dots is 0.100 corrected values] 15 16 Xc (cm) te(s) 6 7 0 12 3 14. X(cm) t(s) đa (cm) | V (cm/s) 0 0 2.18 0.1002 .182 .0 4.890.200 12.7127.00 2. 5 0.30 3.67 36.70 12.88 o.quo 4.32 430 f 9.95 O S 10 .20 zich were 1 1 tbalo 30,56 38.0 74.50 46.43 0.900 8.8 84.43 55-25 88.00 1101.30 65.39 1.100...
need help on this graph
Physies 195 - Straight-line kinematics Data: Dot period=1/10s: the time interval between dots is 0.100 corrected values] 15 16 Xc (cm) te(s) 6 7 0 12 3 14. X(cm) t(s) đa (cm) | V (cm/s) 0 0 2.18 0.1002 .182 .0 4.890.200 12.7127.00 2. 5 0.30 3.67 36.70 12.88 o.quo 4.32 430 f 9.95 O S 10 .20 zich were 1 1 tbalo 30,56 38.0 74.50 46.43 0.900 8.8 84.43 55-25 88.00 1101.30 65.39 1.100...
 Please show all your work.
5) Acceleration is to velocity as velocity is to position . aaux"# r where vr įs the instantaneous velocity. So the average acceleration is about how rapidly the instantaneous velocity is changing, and the sign tells about the direction of the change. At For the pendulum, you made estimates of the instantaneous velocity for ←2.05[s] and t= 2.5%]. Also, the average speed and average velocity estimates that you made at other times may be reasonable...
Please show all your work.
5) Acceleration is to velocity as velocity is to position . aaux"# r where vr įs the instantaneous velocity. So the average acceleration is about how rapidly the instantaneous velocity is changing, and the sign tells about the direction of the change. At For the pendulum, you made estimates of the instantaneous velocity for ←2.05[s] and t= 2.5%]. Also, the average speed and average velocity estimates that you made at other times may be reasonable...
 1. Which of the following equations are dimensionally correct? a.) V = V1 + ax (10p) b.) y = (2m)cos(kx), where k = 2m-1 (10p) 2. Given the vectors A = 2.001 + 6.00j andB = 3.00i + 2.00j. a.) draw the vector sum C = A + B and the vector differenceD = A - B. (10p) b.) Calculate C and D, first in terms of unit vectors and then in terms of polar coordinates, with angles measured with...
 hello,
I need help with this for a homework problem soon. this is
just one question with multiple parts i'd greatly appreciate
it.
a) (5 pts) During free fall, after some object has been thrown upwards, the velocity momentarily goes to zero at the highest point in the trajectory. Some people (falsely) believe that the acceleration of the object also becomes zero at the highest point in the trajectory. Briefly explain what the motion of the object would look like...
hello,
I need help with this for a homework problem soon. this is
just one question with multiple parts i'd greatly appreciate
it.
a) (5 pts) During free fall, after some object has been thrown upwards, the velocity momentarily goes to zero at the highest point in the trajectory. Some people (falsely) believe that the acceleration of the object also becomes zero at the highest point in the trajectory. Briefly explain what the motion of the object would look like...
 h gr f j b k a Time t Select the point(s) on graph from options that has negative acceleration (Select all that apply). ( take the reference of above t vs v graph) k b f h Velocity
h gr f j b k a Time t Select the point(s) on graph from options that has negative acceleration (Select all that apply). ( take the reference of above t vs v graph) k b f h Velocity
h gr f j b k a Time t Select the point(s) on graph from options that has negative acceleration (Select all that apply). ( take the reference of above t vs v graph) k b f h Velocity
Most questions answered within 3 hours.
-
Where is the error in this code sequence?
String s1 = "Hello";
String s2 = "ello";...
asked 10 months ago -
Financial data for Joel de Paris, Inc., for last year
follow:
Joel de Paris, Inc.
Balance...
asked 10 months ago -
Consider this reaction:
Al2(SO4)3 (aq)+ BaCl3
(aq) Al2Cl6 (aq)- +
3BaSO4(s) . What is the...
asked 10 months ago -
Suppose that Savneet is considering increasing her
recent random sample from 20 car rentals to 40...
asked 10 months ago -
Trucks arrive at an unloading terminal at an average rate of 120
per hour.
Trucks arrive...
asked 10 months ago -
Why are methanol and ethanol completely soluble in water while
octanol is not very little soluble....
asked 10 months ago -
A facilities manager at a university reads in a research report
that the mean amount of...
asked 10 months ago -
When the CuSO4 is rehydrated by adding water to the anhydrous
compound, is this an endothermic...
asked 10 months ago -
A ray of sunlight is passing from diamond into crown glass; the
angle of incidence is...
asked 10 months ago -
A block of mass 0.249 kg is placed on top of a light, vertical
spring of...
asked 10 months ago -
how do the kidneys compensate in the presences of acidosis
a) trigger hyperventilate
b) reserve acid...
asked 10 months ago -
Question 501 pts
The rental rate of capital to the firm increases. Which of the
following...
asked 10 months ago