Given this sample of 20 golf scores: 82 68 62 125 81 79 88 95 97 ...
Given this sample of 20 golf scores:
82 68 62 125
81 79 88 95
97 108
66 135 126 118
82 79 87 65
120 136
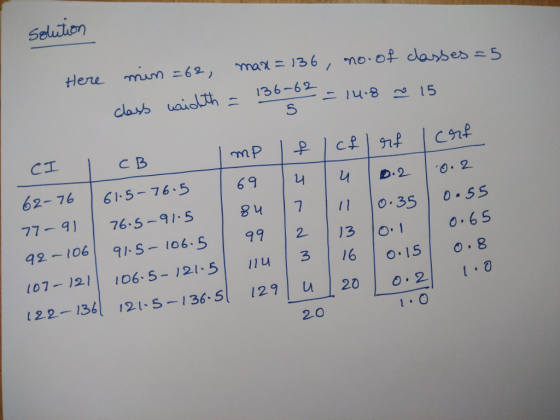
1. Using the golf score data, make a Frequency Distribution with 5
classes. (label: c, cb, mp, f, cf, rf, crf)
2. Then, construct a Histogram for the data.
Homework Answers
Here we have no.of classes 5
and from the data we can take minimum & maximum value
then find the class width

Add Answer to:
Given this sample of 20 golf scores:
82 68 62 125
81 79 88 95
97 ...
Data Set given for pulse rates 68 78 79 80 85 85 87 88 90 91...
Data Set given for pulse rates 68 78 79 80 85 85 87 88 90 91 92 95 96 97 100 102 103 110 114 125 What percentile is 97 located at?
1. On the following page are the exam scores on the first Statistics test for all...
1. On the following page are the exam scores on the first Statistics test for all my classes. Using everything we covered in the first three chapters of our textbook, describe the data. I recommend going through your notes and textbook, chapter by chapter. Include as much as you can – type of data, frequency distribution, histogram, numerical methods, etc. The standard deviation for the data is 16.7. Exam Scores on the First Statistics Test 100 88 100 86 100...
2.) Below is a data set for a set of scores on a final exam: 63,...
 2.) Below is a data set for a set of scores on a final exam: 63, 88, 79, 92, 86, 87, 83, 78, 41, 67, 68, 76, 46, 81, 92,77, 84, 76, 70, 66. 77, 75, 98, 81, 82,81, 87, 78, 80, 60, 94, 79, 52, 82, 77, 61, 77, 70, 74, 61 Complete the following questions: (4 points total) (1 point each) a.) Create a frequency distribution by hand b.) Create a histogram by hand c.) Create a stem-and-leaf...
52 97 66 109 59 59 58 83 98 98 82 91 43 107 88 84...
52 97 66 109 59 59 58 83 98 98 82 91 43 107 88 84 91 73 112 87 91 137 73 108 64 96 119 87 Construct a grouped frequency distribution table (GFDT) for this data set. You want 10 classes with a "nice" class width. Your classes should be labeled using interval notation. Each class contains its lower class limit, and the lower class limits should all be multiples of the class width. In that the data...
Boats (tens of thousands) Manatees 66 55 65 38 69 34 67 49 74 42 75 59 78 53 84 69 81 82 87 79 90 81 94 93 92 74 98 67 99 78 102 91 100 73 98 91 97 97 93 82 8...
 Boats (tens of
thousands) Manatees
66 55
65 38
69 34
67 49
74 42
75 59
78 53
84 69
81 82
87 79
90 81
94 93
92 74
98 67
99 78
102 91
100 73
98 91
97 97
93 82
88 89
87 80
90 71
92 68
idrresponding numbe o ms for 880.000 registered Use the accompanying paired data consisting of registered boats (tens of thousands) and manatee fatalities from boat encounters. Let x...
Boats (tens of
thousands) Manatees
66 55
65 38
69 34
67 49
74 42
75 59
78 53
84 69
81 82
87 79
90 81
94 93
92 74
98 67
99 78
102 91
100 73
98 91
97 97
93 82
88 89
87 80
90 71
92 68
idrresponding numbe o ms for 880.000 registered Use the accompanying paired data consisting of registered boats (tens of thousands) and manatee fatalities from boat encounters. Let x...
Use the accompanying data set on the pulse rates (in beats per minute) of males to...
Use the accompanying data set on the pulse rates (in beats per minute) of males to complete parts (a) and (b) below. LOADING... Click the icon to view the pulse rates of males. a. Find the mean and standard deviation, and verify that the pulse rates have a distribution that is roughly normal. The mean of the pulse rates is 71.871.8 beats per minute. (Round to one decimal place as needed.) The standard deviation of the pulse rates is 12.212.2...
11. A random sample of 72 guinea pigs was taken and injected with infcabious bacteria. Their...
 11. A random sample of 72 guinea pigs was taken and injected with infcabious bacteria. Their survival times are: 43, 45, 53, 56, 56, 57, 58, 66, 67, 73, 74, 79, 80, 80, 81, 81, 81, 82, 83, 83, 84, 88, 89, 91, 91, 92, 92, 97, 99, 99, 100, 100, 101, 102, 102, 102, 103, 104, 107, 108, 109, 113, 114, 118, 121, 123, 126, 128, 137, 138, 139, 144, 145, 147, 156, 162, 174, 178, 179, 184, 191,...
11. A random sample of 72 guinea pigs was taken and injected with infectious bacteria. Their...
 11. A random sample of 72 guinea pigs was taken and injected with infectious bacteria. Their survival times are: 43, 45, 53, 56, 56, 57, 58, 66, 67, 73, 74, 79, 80, 80, 81, 81, 81, 82, 83, 83, 84, 88, 89, 91, 91, 92, 92, 97, 99, 99, 100, 100, 101, 102, 102, 102, 103, 104, 107, 108, 109, 113, 114, 118, 121, 123, 126, 128, 137, 138, 139, 144, 145, 147, 156, 162, 174, 178, 179, 184, 191,...
2. Assume that the first set of scores below represents the IQ scores of children who...
2. Assume that the first set of scores below represents the IQ scores of children who have been participating in a school lunch program and the second set of scores represent the IQs of a similar group of children who have not participated in the program. a. Prepare appropriate graphical representations of the frequency and relative frequency distributions. b. Compare the two distributions by placing them on the same graph. Be sure to have equivalent intervals, if grouped....
The following are the IQ scores of 60 students from a university. The histogram of the...
The following are the IQ scores of 60 students from a university. The histogram of the data is symmetric. 79 79 81 82 82 84 84 84 85 85 86 86 87 89 89 89 90 90 90 91 91 92 92 93 94 95 95 96 98 99 99 102 102 102 103 104 104 104 105 106 106 106 108 109 109 110 111 111 113 113 113 115 117 117 120 121 123 124 125 130 a....
 2.) Below is a data set for a set of scores on a final exam: 63, 88, 79, 92, 86, 87, 83, 78, 41, 67, 68, 76, 46, 81, 92,77, 84, 76, 70, 66. 77, 75, 98, 81, 82,81, 87, 78, 80, 60, 94, 79, 52, 82, 77, 61, 77, 70, 74, 61 Complete the following questions: (4 points total) (1 point each) a.) Create a frequency distribution by hand b.) Create a histogram by hand c.) Create a stem-and-leaf...
 Boats (tens of
thousands) Manatees
66 55
65 38
69 34
67 49
74 42
75 59
78 53
84 69
81 82
87 79
90 81
94 93
92 74
98 67
99 78
102 91
100 73
98 91
97 97
93 82
88 89
87 80
90 71
92 68
idrresponding numbe o ms for 880.000 registered Use the accompanying paired data consisting of registered boats (tens of thousands) and manatee fatalities from boat encounters. Let x...
Boats (tens of
thousands) Manatees
66 55
65 38
69 34
67 49
74 42
75 59
78 53
84 69
81 82
87 79
90 81
94 93
92 74
98 67
99 78
102 91
100 73
98 91
97 97
93 82
88 89
87 80
90 71
92 68
idrresponding numbe o ms for 880.000 registered Use the accompanying paired data consisting of registered boats (tens of thousands) and manatee fatalities from boat encounters. Let x...
 11. A random sample of 72 guinea pigs was taken and injected with infcabious bacteria. Their survival times are: 43, 45, 53, 56, 56, 57, 58, 66, 67, 73, 74, 79, 80, 80, 81, 81, 81, 82, 83, 83, 84, 88, 89, 91, 91, 92, 92, 97, 99, 99, 100, 100, 101, 102, 102, 102, 103, 104, 107, 108, 109, 113, 114, 118, 121, 123, 126, 128, 137, 138, 139, 144, 145, 147, 156, 162, 174, 178, 179, 184, 191,...
 11. A random sample of 72 guinea pigs was taken and injected with infectious bacteria. Their survival times are: 43, 45, 53, 56, 56, 57, 58, 66, 67, 73, 74, 79, 80, 80, 81, 81, 81, 82, 83, 83, 84, 88, 89, 91, 91, 92, 92, 97, 99, 99, 100, 100, 101, 102, 102, 102, 103, 104, 107, 108, 109, 113, 114, 118, 121, 123, 126, 128, 137, 138, 139, 144, 145, 147, 156, 162, 174, 178, 179, 184, 191,...
Most questions answered within 3 hours.
-
Where is the error in this code sequence?
String s1 = "Hello";
String s2 = "ello";...
asked 11 months ago -
Financial data for Joel de Paris, Inc., for last year
follow:
Joel de Paris, Inc.
Balance...
asked 11 months ago -
Consider this reaction:
Al2(SO4)3 (aq)+ BaCl3
(aq) Al2Cl6 (aq)- +
3BaSO4(s) . What is the...
asked 11 months ago -
Suppose that Savneet is considering increasing her
recent random sample from 20 car rentals to 40...
asked 11 months ago -
Trucks arrive at an unloading terminal at an average rate of 120
per hour.
Trucks arrive...
asked 11 months ago -
Why are methanol and ethanol completely soluble in water while
octanol is not very little soluble....
asked 11 months ago -
A facilities manager at a university reads in a research report
that the mean amount of...
asked 11 months ago -
When the CuSO4 is rehydrated by adding water to the anhydrous
compound, is this an endothermic...
asked 11 months ago -
A ray of sunlight is passing from diamond into crown glass; the
angle of incidence is...
asked 11 months ago -
A block of mass 0.249 kg is placed on top of a light, vertical
spring of...
asked 11 months ago -
how do the kidneys compensate in the presences of acidosis
a) trigger hyperventilate
b) reserve acid...
asked 11 months ago -
Question 501 pts
The rental rate of capital to the firm increases. Which of the
following...
asked 11 months ago