2. Assume that the first set of scores below represents the IQ scores of children who...
2. Assume that the first set of scores below represents the IQ scores of children
who have been participating in a school lunch program and the second set of scores represent the IQs of a similar group of children who have not participated in the program.
a. Prepare appropriate graphical representations of the frequency and relative frequency distributions.
b. Compare the two distributions by placing them on the same graph. Be sure to have equivalent intervals, if grouped. Why did you decide to compare frequencies, or relative frequencies?
3. Assume that the third set below are data from a survey of riders of a city bus system. Each rider was asked to indicate the number of times he or she had taken a bus on a Sunday during the previous month. Prepare a graphical representation of the relative frequency data.
|
|
|
Homework Answers
1a.
Set 1:
 Set 2:
Set 3;

Please post the other questions separately as we are supposed to answer just one question or four sub parts of the same question.
Add Answer to:
2. Assume that the
first set of scores below represents the IQ scores of children
who...
1. For each set below, using Excel, construct a. a frequency distribution, ...
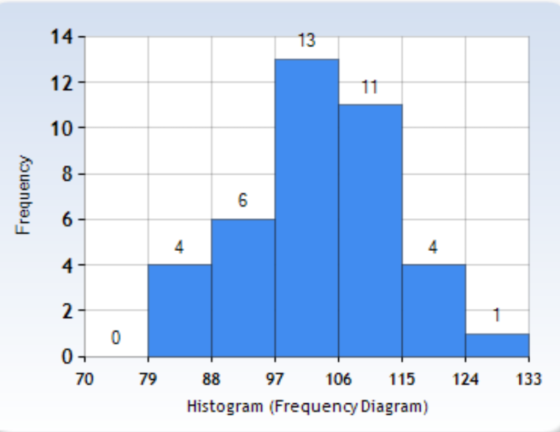
1. For each set below, using Excel, construct a. a frequency distribution, b. a relative frequency distribution, and c. a cumulative relative frequency distribution. Consider whether or not you should group your data. Describe how you determined your bin width, if you grouped the data in intervals. Set 1 75 95 103 100 93 91 90 92 89 105 86 85 81 96 103 99 94 95 91 97 92 107...
The following are the IQ scores of 60 students from a university. The histogram of the...
The following are the IQ scores of 60 students from a university. The histogram of the data is symmetric. 79 79 81 82 82 84 84 84 85 85 86 86 87 89 89 89 90 90 90 91 91 92 92 93 94 95 95 96 98 99 99 102 102 102 103 104 104 104 105 106 106 106 108 109 109 110 111 111 113 113 113 115 117 117 120 121 123 124 125 130 a....
USE R AND SHOW CODES!! The IQ was measured for 35 twins. Is there any difference...
USE R AND SHOW CODES!! The IQ was measured for 35 twins. Is there any difference in IQ between twins? DATA Twin 1 Twin 2 113 109 94 100 99 86 77 80 81 95 91 106 111 117 104 107 85 85 66 84 111 125 51 66 109 108 122 121 97 98 82 94 100 88 100 104 93 84 99 95 109 98 95 100 75 86 104 103 73 78 88 99 92 111 108...
ASAP HELP!! A test was given to 50 fourth grade students The scores for the students...
 ASAP HELP!!
A test was given to 50 fourth grade students The scores for the students are given below. 93 108 91 116 92 87 100 88 109 110 91 119 88 100 86 119 113 85 103 118 100 112 87 95 95 94 114 87 119 96 113 100 112 100 107 93 91 95 111 108 110 88 117 101 88 97 118 87 114 103 (a) Construct a grouped frequency distribution for the data. Use 85-89...
ASAP HELP!!
A test was given to 50 fourth grade students The scores for the students are given below. 93 108 91 116 92 87 100 88 109 110 91 119 88 100 86 119 113 85 103 118 100 112 87 95 95 94 114 87 119 96 113 100 112 100 107 93 91 95 111 108 110 88 117 101 88 97 118 87 114 103 (a) Construct a grouped frequency distribution for the data. Use 85-89...
Each of the following three data sets represents the 1Q scores of a random sample For...
 Each of the following three data sets represents the 1Q scores of a random sample For each data set, compute the mean and median. of adults. IQ scores are known to have a mean and median of 100. What is the mean of the sample of size 5? Full data set Sample of Size 5 104 108 105 91 Type an integer or decimal rounded to one decimal place as needed.) What is the mean of the sample of size...
weight of 30 people: 81, 82, 83, 84, 85, 86, 87, 88, 89, 90, 91, 92,...
 weight of 30 people:
81, 82, 83, 84, 85, 86, 87, 88, 89, 90, 91, 92, 93, 94, 95, 96,
97, 98, 99, 100, 101, 102, 103, 104, 105, 106, 107, 108, 109,
110
screenshot of matlab is needed, please and thank you
Create your own data that represents the weight of 30 people.Test the null hypothesis that the data comes from a normal distribution with mean mu = 70 and standard deviation sigma = 8. Hint: use the “ztest"...
weight of 30 people:
81, 82, 83, 84, 85, 86, 87, 88, 89, 90, 91, 92, 93, 94, 95, 96,
97, 98, 99, 100, 101, 102, 103, 104, 105, 106, 107, 108, 109,
110
screenshot of matlab is needed, please and thank you
Create your own data that represents the weight of 30 people.Test the null hypothesis that the data comes from a normal distribution with mean mu = 70 and standard deviation sigma = 8. Hint: use the “ztest"...
Due Sunday. Apr 14 All answers will be saved automatically pm PDT All Question1 A high school tea...
 Due Sunday. Apr 14 All answers will be saved automatically pm PDT All Question1 A high school teacher is interested to compare the average time for students to complete a standardized test for three different classes of students The teacher coll classes and the dataset is provided below. lects random data for time to complete the standardized test (in minutes) for students in three different The teacher is interested to know if the average time to complete the standardized test...
1. The data are from the U.S. Department of Health and Human Services, National Center of...
 1. The data are from the U.S. Department of Health and Human Services, National Center of Health Statistics, Third National Health and Nutrition Examination Survey. The systolic blood pressure (mmHg) for 80 patients was measured. The following data is separated by gender Females: 89 92 93 93 94 95 97 98 99 100 101 102 104 104 104 105 106 106 107 107 107 108 108 110 112 113 113 114 114 116 116 118 119 123 124 125 127...
Here are the IQ test scores of 31 seventh-grade girls in a Midwest school district: 114...
Here are the IQ test scores of 31 seventh-grade girls in a Midwest school district: 114 100 104 89 102 91 114 114 103 105 108 130 120 132 111 128 118 119 86 72 111 103 74 112 107 103 98 96 112 112 93 These 31 girls are an SRS of all seventh-grade girls in the school district. Suppose that the standard deviation of IQ scores in this population is known to be σ σ = 15. We...
Here are the IQ test scores of 31 seventh-grade girls in a Midwest school district: 114 100 104 89 102 91 114 114 103...
Here are the IQ test scores of 31 seventh-grade girls in a Midwest school district: 114 100 104 89 102 91 114 114 103 105 108 130 120 132 111 128 118 119 86 72 111 103 74 112 107 103 98 96 112 112 93 These 31 girls are an SRS of all seventh-grade girls in the school district. Suppose that the standard deviation of IQ scores in this population is known to be σ = 15. We expect...
 ASAP HELP!!
A test was given to 50 fourth grade students The scores for the students are given below. 93 108 91 116 92 87 100 88 109 110 91 119 88 100 86 119 113 85 103 118 100 112 87 95 95 94 114 87 119 96 113 100 112 100 107 93 91 95 111 108 110 88 117 101 88 97 118 87 114 103 (a) Construct a grouped frequency distribution for the data. Use 85-89...
ASAP HELP!!
A test was given to 50 fourth grade students The scores for the students are given below. 93 108 91 116 92 87 100 88 109 110 91 119 88 100 86 119 113 85 103 118 100 112 87 95 95 94 114 87 119 96 113 100 112 100 107 93 91 95 111 108 110 88 117 101 88 97 118 87 114 103 (a) Construct a grouped frequency distribution for the data. Use 85-89...
 Each of the following three data sets represents the 1Q scores of a random sample For each data set, compute the mean and median. of adults. IQ scores are known to have a mean and median of 100. What is the mean of the sample of size 5? Full data set Sample of Size 5 104 108 105 91 Type an integer or decimal rounded to one decimal place as needed.) What is the mean of the sample of size...
 weight of 30 people:
81, 82, 83, 84, 85, 86, 87, 88, 89, 90, 91, 92, 93, 94, 95, 96,
97, 98, 99, 100, 101, 102, 103, 104, 105, 106, 107, 108, 109,
110
screenshot of matlab is needed, please and thank you
Create your own data that represents the weight of 30 people.Test the null hypothesis that the data comes from a normal distribution with mean mu = 70 and standard deviation sigma = 8. Hint: use the “ztest"...
weight of 30 people:
81, 82, 83, 84, 85, 86, 87, 88, 89, 90, 91, 92, 93, 94, 95, 96,
97, 98, 99, 100, 101, 102, 103, 104, 105, 106, 107, 108, 109,
110
screenshot of matlab is needed, please and thank you
Create your own data that represents the weight of 30 people.Test the null hypothesis that the data comes from a normal distribution with mean mu = 70 and standard deviation sigma = 8. Hint: use the “ztest"...
 Due Sunday. Apr 14 All answers will be saved automatically pm PDT All Question1 A high school teacher is interested to compare the average time for students to complete a standardized test for three different classes of students The teacher coll classes and the dataset is provided below. lects random data for time to complete the standardized test (in minutes) for students in three different The teacher is interested to know if the average time to complete the standardized test...
 1. The data are from the U.S. Department of Health and Human Services, National Center of Health Statistics, Third National Health and Nutrition Examination Survey. The systolic blood pressure (mmHg) for 80 patients was measured. The following data is separated by gender Females: 89 92 93 93 94 95 97 98 99 100 101 102 104 104 104 105 106 106 107 107 107 108 108 110 112 113 113 114 114 116 116 118 119 123 124 125 127...
Most questions answered within 3 hours.
-
Where is the error in this code sequence?
String s1 = "Hello";
String s2 = "ello";...
asked 11 months ago -
Financial data for Joel de Paris, Inc., for last year
follow:
Joel de Paris, Inc.
Balance...
asked 11 months ago -
Consider this reaction:
Al2(SO4)3 (aq)+ BaCl3
(aq) Al2Cl6 (aq)- +
3BaSO4(s) . What is the...
asked 11 months ago -
Suppose that Savneet is considering increasing her
recent random sample from 20 car rentals to 40...
asked 11 months ago -
Trucks arrive at an unloading terminal at an average rate of 120
per hour.
Trucks arrive...
asked 11 months ago -
Why are methanol and ethanol completely soluble in water while
octanol is not very little soluble....
asked 11 months ago -
A facilities manager at a university reads in a research report
that the mean amount of...
asked 11 months ago -
When the CuSO4 is rehydrated by adding water to the anhydrous
compound, is this an endothermic...
asked 11 months ago -
A ray of sunlight is passing from diamond into crown glass; the
angle of incidence is...
asked 11 months ago -
A block of mass 0.249 kg is placed on top of a light, vertical
spring of...
asked 11 months ago -
how do the kidneys compensate in the presences of acidosis
a) trigger hyperventilate
b) reserve acid...
asked 11 months ago -
Question 501 pts
The rental rate of capital to the firm increases. Which of the
following...
asked 11 months ago