Here are the IQ test scores of 31 seventh-grade girls in a Midwest school district: 114 100 104 89 102 91 114 114 103...
Here are the IQ test scores of 31 seventh-grade girls in a Midwest school district:
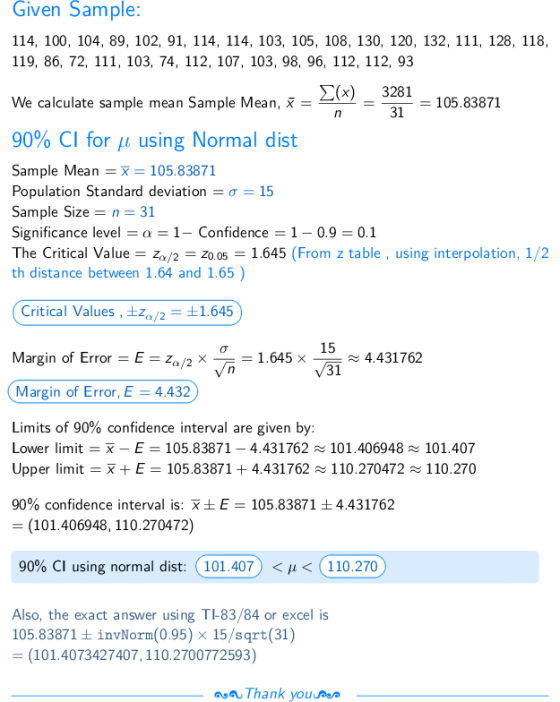
114 100 104 89 102 91 114 114 103 105 108 130 120 132 111 128 118 119 86 72 111 103 74 112 107 103 98 96 112 112 93
These 31 girls are an SRS of all seventh-grade girls in the school district. Suppose that the standard deviation of IQ scores in this population is known to be σ = 15. We expect the distribution of IQ scores to be close to Normal. Estimate the mean IQ score for all seventh-grade girls in the school district, using a 98% confidence interval.
Homework Answers

Add Answer to:
Here are the IQ test scores of 31 seventh-grade girls in a
Midwest school district:
114 100 104 89 102 91 114 114 103...
Here are the IQ test scores of 31 seventh-grade girls in a Midwest school district: 114...
Here are the IQ test scores of 31 seventh-grade girls in a Midwest school district: 114 100 104 89 102 91 114 114 103 105 108 130 120 132 111 128 118 119 86 72 111 103 74 112 107 103 98 96 112 112 93 These 31 girls are an SRS of all seventh-grade girls in the school district. Suppose that the standard deviation of IQ scores in this population is known to be σ σ = 15. We...
(16.07) Here are the IQ test scores of 31 seventh-grade girls in a Midwest school district:...
(16.07) Here are the IQ test scores of 31 seventh-grade girls in a Midwest school district: 114 100 104 89 102 91 114 114 103 105 108 130 120 132 111 128 118 119 86 72 111 103 74 112 107 103 98 96 112 112 93 These 31 girls are an SRS of all seventh-grade girls in the school district. Suppose that the standard deviation of IQ scores in this population is known to beσ= 15. We expect the...
(3.46) Here are the IQ test scores of 31 seventh-grade girls in a Midwest school district:...
 (3.46) Here are the IQ test scores of 31 seventh-grade girls in a Midwest school district: 14 100 104 89 102 91 114 114 103 105 108 130 120 132 1 128 18 119 8672 1 103 74 112 107 103 9896 112 112 93 Data Set eBook Step 1 We expect IQ scores to be approximately Normal Make a stemplot to check that there are no major departures from Normality. Use stems with units of tenths. Match your results...
. We have IQ test scores of 31 seventh-grade girls in a Midwest school district. We...
. We have IQ test scores of 31 seventh-grade girls in a Midwest school district. We have calculated that sample mean is 105.84 and the standard deviation is 14.27. a. Give a 99% confidence interval for the average score in the population. What is the margin of error?
Boys 111 107 100 The data to the left are IQ test scores for 47 seventh...
 Boys 111 107 100 The data to the left are IQ test scores for 47 seventh grade boys and 31 seventh grade girls from a Midwestern school district. 107 115 111 104 106 Do a test of hypothesis to see whether the mean test scores of the two groups are the same or different. Assume that the data represent a random sample from the population of 7th grade boys and girls from this school district. 113 109 113 128 128...
ASAP HELP!! A test was given to 50 fourth grade students The scores for the students...
 ASAP HELP!!
A test was given to 50 fourth grade students The scores for the students are given below. 93 108 91 116 92 87 100 88 109 110 91 119 88 100 86 119 113 85 103 118 100 112 87 95 95 94 114 87 119 96 113 100 112 100 107 93 91 95 111 108 110 88 117 101 88 97 118 87 114 103 (a) Construct a grouped frequency distribution for the data. Use 85-89...
ASAP HELP!!
A test was given to 50 fourth grade students The scores for the students are given below. 93 108 91 116 92 87 100 88 109 110 91 119 88 100 86 119 113 85 103 118 100 112 87 95 95 94 114 87 119 96 113 100 112 100 107 93 91 95 111 108 110 88 117 101 88 97 118 87 114 103 (a) Construct a grouped frequency distribution for the data. Use 85-89...
Please answer all parts. No need to explain your answer. 18. (3.46) Here are the IQ...
 Please answer all parts. No need to explain your answer.
18. (3.46) Here are the IQ test scores of 31 seventh-grade girls in a Midwest school district: 14 100 104 89 102 91 114 114 103 105 108 130 120 132 128 118 119 8672 1 103 74 112 107 103 98 96 112 112 93 Data Set eBook Step 1: We expect IQ scores to be approximately Normal. Make a stemplot to check that there are no major departures...
Please answer all parts. No need to explain your answer.
18. (3.46) Here are the IQ test scores of 31 seventh-grade girls in a Midwest school district: 14 100 104 89 102 91 114 114 103 105 108 130 120 132 128 118 119 8672 1 103 74 112 107 103 98 96 112 112 93 Data Set eBook Step 1: We expect IQ scores to be approximately Normal. Make a stemplot to check that there are no major departures...
2. Assume that the first set of scores below represents the IQ scores of children who...
2. Assume that the first set of scores below represents the IQ scores of children who have been participating in a school lunch program and the second set of scores represent the IQs of a similar group of children who have not participated in the program. a. Prepare appropriate graphical representations of the frequency and relative frequency distributions. b. Compare the two distributions by placing them on the same graph. Be sure to have equivalent intervals, if grouped....
Case X Y 108 133 132 3 109 114 4 118 110 5 94 98 6...
 Case X Y 108 133 132 3 109 114 4 118 110 5 94 98 6 111 103 7 107 6 8 125 130 9 120 122 10 119 126 11 127 122 12 109 118 13 90 95 14 95 103 15 112 118 16 100 94 17 93 90 107 11 18 19 122 114 20 118 124 21 109 116 22 112 117 23 121 109 24 109 107 25 12 110 3 рoints их 3 рoints...
Weight IQ 88 99 112 103 107 97 112 99 80 100 86 90 103 118...
Weight IQ 88 99 112 103 107 97 112 99 80 100 86 90 103 118 121 79 116 80 82 88 65 82 107 103 100 116 91 112 110 92 113 115 105 100 108 94 90 118 73 106 102 126 99 95 80 119 114 116 90 79 95 92 106 78 86 111 106 80 Use the Weight_vs_IQ data. SETUP: Common sense dictates that a person’s IQ and Weight should not be related. However, one...
 (3.46) Here are the IQ test scores of 31 seventh-grade girls in a Midwest school district: 14 100 104 89 102 91 114 114 103 105 108 130 120 132 1 128 18 119 8672 1 103 74 112 107 103 9896 112 112 93 Data Set eBook Step 1 We expect IQ scores to be approximately Normal Make a stemplot to check that there are no major departures from Normality. Use stems with units of tenths. Match your results...
 Boys 111 107 100 The data to the left are IQ test scores for 47 seventh grade boys and 31 seventh grade girls from a Midwestern school district. 107 115 111 104 106 Do a test of hypothesis to see whether the mean test scores of the two groups are the same or different. Assume that the data represent a random sample from the population of 7th grade boys and girls from this school district. 113 109 113 128 128...
 ASAP HELP!!
A test was given to 50 fourth grade students The scores for the students are given below. 93 108 91 116 92 87 100 88 109 110 91 119 88 100 86 119 113 85 103 118 100 112 87 95 95 94 114 87 119 96 113 100 112 100 107 93 91 95 111 108 110 88 117 101 88 97 118 87 114 103 (a) Construct a grouped frequency distribution for the data. Use 85-89...
ASAP HELP!!
A test was given to 50 fourth grade students The scores for the students are given below. 93 108 91 116 92 87 100 88 109 110 91 119 88 100 86 119 113 85 103 118 100 112 87 95 95 94 114 87 119 96 113 100 112 100 107 93 91 95 111 108 110 88 117 101 88 97 118 87 114 103 (a) Construct a grouped frequency distribution for the data. Use 85-89...
 Please answer all parts. No need to explain your answer.
18. (3.46) Here are the IQ test scores of 31 seventh-grade girls in a Midwest school district: 14 100 104 89 102 91 114 114 103 105 108 130 120 132 128 118 119 8672 1 103 74 112 107 103 98 96 112 112 93 Data Set eBook Step 1: We expect IQ scores to be approximately Normal. Make a stemplot to check that there are no major departures...
Please answer all parts. No need to explain your answer.
18. (3.46) Here are the IQ test scores of 31 seventh-grade girls in a Midwest school district: 14 100 104 89 102 91 114 114 103 105 108 130 120 132 128 118 119 8672 1 103 74 112 107 103 98 96 112 112 93 Data Set eBook Step 1: We expect IQ scores to be approximately Normal. Make a stemplot to check that there are no major departures...
 Case X Y 108 133 132 3 109 114 4 118 110 5 94 98 6 111 103 7 107 6 8 125 130 9 120 122 10 119 126 11 127 122 12 109 118 13 90 95 14 95 103 15 112 118 16 100 94 17 93 90 107 11 18 19 122 114 20 118 124 21 109 116 22 112 117 23 121 109 24 109 107 25 12 110 3 рoints их 3 рoints...
Most questions answered within 3 hours.
-
Where is the error in this code sequence?
String s1 = "Hello";
String s2 = "ello";...
asked 11 months ago -
Financial data for Joel de Paris, Inc., for last year
follow:
Joel de Paris, Inc.
Balance...
asked 11 months ago -
Consider this reaction:
Al2(SO4)3 (aq)+ BaCl3
(aq) Al2Cl6 (aq)- +
3BaSO4(s) . What is the...
asked 11 months ago -
Suppose that Savneet is considering increasing her
recent random sample from 20 car rentals to 40...
asked 11 months ago -
Trucks arrive at an unloading terminal at an average rate of 120
per hour.
Trucks arrive...
asked 11 months ago -
Why are methanol and ethanol completely soluble in water while
octanol is not very little soluble....
asked 11 months ago -
A facilities manager at a university reads in a research report
that the mean amount of...
asked 11 months ago -
When the CuSO4 is rehydrated by adding water to the anhydrous
compound, is this an endothermic...
asked 11 months ago -
A ray of sunlight is passing from diamond into crown glass; the
angle of incidence is...
asked 11 months ago -
A block of mass 0.249 kg is placed on top of a light, vertical
spring of...
asked 11 months ago -
how do the kidneys compensate in the presences of acidosis
a) trigger hyperventilate
b) reserve acid...
asked 11 months ago -
Question 501 pts
The rental rate of capital to the firm increases. Which of the
following...
asked 11 months ago