
Homework Answers
Answer
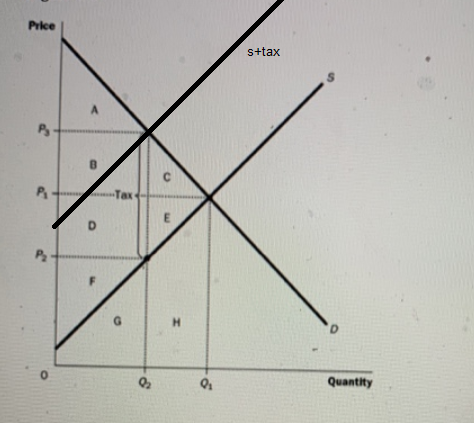
after-tax supply curve shifts to the left
After-tax equilibrium is at S+tax=D
where
Q=Q2 and P=P3=buyer pay and P=P2=seller receives
Option 3
P3 and Q2
Add Answer to:
Question 32 (1 point) Figure 8-5 Price Quantity Refer to Figure 8-5. What is the price...
T А 1 Price, Cost P4 a P3 P2 B Pi Quantity 0 Q1 Q2 If...
 T А 1 Price, Cost P4 a P3 P2 B Pi Quantity 0 Q1 Q2 If a positive externality exists then the socially optimal price is OP2 OP3 Op4 OP1
QUESTION 3 Figure Price Supply P K I P" P B M N Demand Quantity Refer...
 QUESTION 3 Figure Price Supply P K I P" P B M N Demand Quantity Refer to Figure. If the government imposes a tax size of P- P" in the above market then the area L+M+Y represents a. consumer surplus after the tax. producer surplus after the tax. Cconsumer surplus before the tax. producer surplus before the tax. QUESTION 4 4 point Figure Supply Dennd Quantity Q1 02 Q3 Q Qs Refer to Figure. If the government impose a tax...
Question 2 1 pts Figure 8-1 1 Price Supply Demand Quantity Refer to Figure 8-1. Suppose...
 Question 2 1 pts Figure 8-1 1 Price Supply Demand Quantity Refer to Figure 8-1. Suppose the government imposes a tax of p'-P". The consumer surplus after the tax is measured by the area J+K+1 OJ OM L+M+Y
Refer to Figure 6-8. The effective price that buyers ay after the tax is imposed is
 6. Refer to Figure 6-8. The effective price that buyers ay after the tax is imposed is 7. Refer to Figure 6-8. The price that sellers receive after the tax is imposed is8. Refer to Figure 6-8. The amount of the tax per unit is 9. Refer to Figure 6-8. The burden of the tax on sellers is 10. Refer to Figure 6-8. Suppose the same Sand D curves apply, and a tax of the same amount per unit as shown here is...
Refer to Figure 1. Suppose a $3 per-unit tax is imposed on the sellers of this good. How much is the burden of this tax on the buyers in this market
 QUESTION #1 Refer to Figure 1. Suppose a $3 per-unit tax is
imposed on the sellers of this good. How much is the burden of this
tax on the buyers in this market? What price will buyers pay for
the good after the tax is imposed? Explain clearly.QUESTION #2 Refer to Figure 1. Suppose a $3 per-unit tax is
imposed on the sellers of this good. How much is the burden of this
tax on the sellers in this market? What is...
QUESTION #1 Refer to Figure 1. Suppose a $3 per-unit tax is
imposed on the sellers of this good. How much is the burden of this
tax on the buyers in this market? What price will buyers pay for
the good after the tax is imposed? Explain clearly.QUESTION #2 Refer to Figure 1. Suppose a $3 per-unit tax is
imposed on the sellers of this good. How much is the burden of this
tax on the sellers in this market? What is...
PRICE Demand Q2 Q1 QUANTITY Refer to Figure 5-4. Total revenue when the price is P...
 PRICE Demand Q2 Q1 QUANTITY Refer to Figure 5-4. Total revenue when the price is P 1 is represented by a. areas A+B. b. areas C+D. C. area D. d. areas B+D. ESTION 11 Which of the following could be the price elasticity of demand for a good for which a decrease in price would increase total revenue? a. 2.8 o 6.0.3 C. 3.6 d. 1 PRICE Demand Q2 Q1 QUANTITY Refer to Figure 5-4. If rectangle D is larger...
Price D 6 8 Quantity 8. Refer to the above graph. Assume the market for this...
 Price D 6 8 Quantity 8. Refer to the above graph. Assume the market for this product is in equilibrium at the intersection of D2 and S. The shift in supply from S to Sz is due to an excise tax imposed on the product. The incidence of the tax is: $1 from the buyers and $3 from the sellers $3 from the buyers and $3 from the sellers $1 from the buyers and $1 from the sellers $4 from...
Figure 1 1 price Sattert 9 8 7 s 6 5 4 3 2 1 2...
 Figure 1 1 price Sattert 9 8 7 s 6 5 4 3 2 1 2 4 6 8 10 12 14 16 qaoxtity Refer to Figure 1. When there is a per-unit tax of $3 imposed on the cigarette, in this case, what is the price that buyers actually pay and what is the price that sellers actually receive? Select one: a. $3, $6. b. $4, $6. c. $6, $3. d. $5, $3.
Question 23 (1 point) Figure 4-18 20 price 1 2 3 4 5 6 7 8...
 Question 23 (1 point) Figure 4-18 20 price 1 2 3 4 5 6 7 8 9 10 quantity Refer to Figure 4-18. What is the equilibrium quantity in this market? a) 7.5 units Ob) 5 units OC) 10 units O d) The equilibrium quantity cannot be determined from this graph. Question 24 (1 point) Figure 4-18 2 prace 1 2 3 4 5 6 7 8 9 10 quantity Refer to Figure 4-18. What is the equilibrium price in...
Refer to Figure 8-6. If the tax is imposed on the buyer, what price would the buyers pay for the good?
 Refer to Figure 8-6. If the tax is imposed on the buyer, what price would the buyers pay for the good?
 T А 1 Price, Cost P4 a P3 P2 B Pi Quantity 0 Q1 Q2 If a positive externality exists then the socially optimal price is OP2 OP3 Op4 OP1
 QUESTION 3 Figure Price Supply P K I P" P B M N Demand Quantity Refer to Figure. If the government imposes a tax size of P- P" in the above market then the area L+M+Y represents a. consumer surplus after the tax. producer surplus after the tax. Cconsumer surplus before the tax. producer surplus before the tax. QUESTION 4 4 point Figure Supply Dennd Quantity Q1 02 Q3 Q Qs Refer to Figure. If the government impose a tax...
 Question 2 1 pts Figure 8-1 1 Price Supply Demand Quantity Refer to Figure 8-1. Suppose the government imposes a tax of p'-P". The consumer surplus after the tax is measured by the area J+K+1 OJ OM L+M+Y
 QUESTION #1 Refer to Figure 1. Suppose a $3 per-unit tax is
imposed on the sellers of this good. How much is the burden of this
tax on the buyers in this market? What price will buyers pay for
the good after the tax is imposed? Explain clearly.QUESTION #2 Refer to Figure 1. Suppose a $3 per-unit tax is
imposed on the sellers of this good. How much is the burden of this
tax on the sellers in this market? What is...
QUESTION #1 Refer to Figure 1. Suppose a $3 per-unit tax is
imposed on the sellers of this good. How much is the burden of this
tax on the buyers in this market? What price will buyers pay for
the good after the tax is imposed? Explain clearly.QUESTION #2 Refer to Figure 1. Suppose a $3 per-unit tax is
imposed on the sellers of this good. How much is the burden of this
tax on the sellers in this market? What is...
 PRICE Demand Q2 Q1 QUANTITY Refer to Figure 5-4. Total revenue when the price is P 1 is represented by a. areas A+B. b. areas C+D. C. area D. d. areas B+D. ESTION 11 Which of the following could be the price elasticity of demand for a good for which a decrease in price would increase total revenue? a. 2.8 o 6.0.3 C. 3.6 d. 1 PRICE Demand Q2 Q1 QUANTITY Refer to Figure 5-4. If rectangle D is larger...
 Price D 6 8 Quantity 8. Refer to the above graph. Assume the market for this product is in equilibrium at the intersection of D2 and S. The shift in supply from S to Sz is due to an excise tax imposed on the product. The incidence of the tax is: $1 from the buyers and $3 from the sellers $3 from the buyers and $3 from the sellers $1 from the buyers and $1 from the sellers $4 from...
 Figure 1 1 price Sattert 9 8 7 s 6 5 4 3 2 1 2 4 6 8 10 12 14 16 qaoxtity Refer to Figure 1. When there is a per-unit tax of $3 imposed on the cigarette, in this case, what is the price that buyers actually pay and what is the price that sellers actually receive? Select one: a. $3, $6. b. $4, $6. c. $6, $3. d. $5, $3.
 Question 23 (1 point) Figure 4-18 20 price 1 2 3 4 5 6 7 8 9 10 quantity Refer to Figure 4-18. What is the equilibrium quantity in this market? a) 7.5 units Ob) 5 units OC) 10 units O d) The equilibrium quantity cannot be determined from this graph. Question 24 (1 point) Figure 4-18 2 prace 1 2 3 4 5 6 7 8 9 10 quantity Refer to Figure 4-18. What is the equilibrium price in...
Most questions answered within 3 hours.
-
Where is the error in this code sequence?
String s1 = "Hello";
String s2 = "ello";...
asked 10 months ago -
Financial data for Joel de Paris, Inc., for last year
follow:
Joel de Paris, Inc.
Balance...
asked 10 months ago -
Consider this reaction:
Al2(SO4)3 (aq)+ BaCl3
(aq) Al2Cl6 (aq)- +
3BaSO4(s) . What is the...
asked 10 months ago -
Suppose that Savneet is considering increasing her
recent random sample from 20 car rentals to 40...
asked 10 months ago -
Trucks arrive at an unloading terminal at an average rate of 120
per hour.
Trucks arrive...
asked 10 months ago -
Why are methanol and ethanol completely soluble in water while
octanol is not very little soluble....
asked 10 months ago -
A facilities manager at a university reads in a research report
that the mean amount of...
asked 10 months ago -
When the CuSO4 is rehydrated by adding water to the anhydrous
compound, is this an endothermic...
asked 10 months ago -
A ray of sunlight is passing from diamond into crown glass; the
angle of incidence is...
asked 10 months ago -
A block of mass 0.249 kg is placed on top of a light, vertical
spring of...
asked 10 months ago -
how do the kidneys compensate in the presences of acidosis
a) trigger hyperventilate
b) reserve acid...
asked 10 months ago -
Question 501 pts
The rental rate of capital to the firm increases. Which of the
following...
asked 10 months ago