


Homework Answers
Answer:
Before trade, the equilibrium is determined by domestic demand and supply. The equilibrium price is $1300 and quantity is 200 tons of soybeans
CS is the region above the price line and below the demand. PS is the region below price and above supply curve

Total surplus = CS + PS = 0.5*(2300 - 300)*200 = $200,000
With trade, producer surplus is increased and consumer surplus is reduced
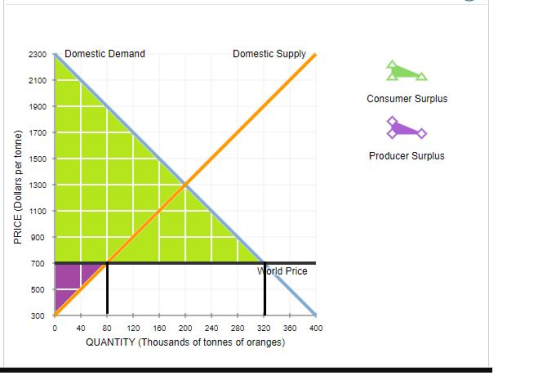
At this price of 700, 320 tons are demanded and 80 tons are supplied. Hence it will export (320 - 80) = 240 tons(in thousand)
CS before trade = 0.5*(2300 - 1300)*200 = 100,000
PS before trade = 0.5*(1300 - 300)*200 = 100,000
Now after trade we see that
CS before trade = 0.5*(2300 - 700)*320 = 256,000
PS before trade = 0.5*(700 - 300)*80 = 16,000
CS increases by (1) 256,000 – 100,000 = 156,000 and PS decreases by (100,000 – 16,000) = 84,000. Net effect of trade is that total surplus is gain by (156,000 - 84,000) = 72,000
Add Answer to:
Use the black point (plus symbol) to indicate the equilibrium price of a tonne of oranges...
3. Consumer Surplus and Producer Surplus from Market Exchange Consider the Zambian market for ora...
 3. Consumer Surplus and Producer Surplus from Market
Exchange
Consider the Zambian market for oranges.
The following graph shows the domestic demand and domestic
supply curves for oranges in Zambia. Suppose Zambia's government
currently does not allow the international trade in oranges.
Use the black point (plus symbol) to indicate the equilibrium
price of a ton of oranges and the equilibrium quantity of oranges
in Zambia in the absence of international trade. Then, use the
green point (triangle symbol) to...
3. Consumer Surplus and Producer Surplus from Market
Exchange
Consider the Zambian market for oranges.
The following graph shows the domestic demand and domestic
supply curves for oranges in Zambia. Suppose Zambia's government
currently does not allow the international trade in oranges.
Use the black point (plus symbol) to indicate the equilibrium
price of a ton of oranges and the equilibrium quantity of oranges
in Zambia in the absence of international trade. Then, use the
green point (triangle symbol) to...
Suppose Zambia is open to free trade in the world market for oranges. Because of Zambia's small size, the demand for and supply of oranges in Zambia do not affect the world price.
 3. Welfare effects of a tariff in a small country Suppose Zambia is open to free trade in the world market for oranges. Because of Zambia's small size, the demand for and supply of oranges in Zambia do not affect the world price. The following graph shows the domestic oranges market in Zambia. The world price of oranges is Pw = $800 per ton. On the following graph, use the green triangle (triangle symbols) to shade the area representing consumer surplus (CS)...
First, use the black point (plus symbol) to indicate the equilibrium price and quantity of mountain...
 First, use the black point (plus symbol) to indicate the equilibrium price and quantity of mountain bikes in the absence of a tax. Then use the green point (triangle symbol) to shade the area representing total consumer surplus (CS) at the equilibrium price. Next, use the purple point (diamond symbol) to shade the area representing total producer surplus (PS) at the equilibrium price. Before Tax Equilibrium Consumer Surplus PRICE (Dollars per bike) Producer Surplus CENGAGE MINDTAP Q Search this course...
Aplia Homework: International Trade 3. Welfare effects of a tariff in a small country Suppose Zambia...
 Aplia Homework: International Trade 3. Welfare effects of a tariff in a small country Suppose Zambia is open to free trade in the world market for soybeans. Because of Zambia's small size, the demand for and supply of soybeans in Zambia do not affect the world price. The following graph shows the domestic soybeans market in Zambia. The world price of soybeans is Pw-$400 per ton On the following graph, use the green triangle (triangle symbols) to shade the area...
fill in the blanks 1)increase/decrease 2)increase/decrease 3)gain/loss Consider the Sudanese market for tangerines. The...
 fill in the blanks
1)increase/decrease
2)increase/decrease
3)gain/loss
Consider the Sudanese market for tangerines. The following graph shows the domestic demand and domestic supply curves for tangerines in Sudan. Suppose Sudan's government currently does not allow international trade in tangerines. Use the black point (plus symbol) to indicate the equilibrium price of a ton of tangerines and the equilibrium quantity of tangerines in Sudan in the absence of international trade. Then, use the green triangle (triangle symbol) to shade the area...
fill in the blanks
1)increase/decrease
2)increase/decrease
3)gain/loss
Consider the Sudanese market for tangerines. The following graph shows the domestic demand and domestic supply curves for tangerines in Sudan. Suppose Sudan's government currently does not allow international trade in tangerines. Use the black point (plus symbol) to indicate the equilibrium price of a ton of tangerines and the equilibrium quantity of tangerines in Sudan in the absence of international trade. Then, use the green triangle (triangle symbol) to shade the area...
Consider the Sudanese market for tangerines The following graph shows the domestic demand and domestic supply...
 Consider the Sudanese market for tangerines The following graph shows the domestic demand and domestic supply curves for tangerines in Sudan. Suppose Sudan's government currently does not allow international trade in tangerines Use the black point (plus symbol) to indicate the equilibrium price of a ton of tangerines and the equilibrium quantity of tangerines in Sudan in the absence of international trade. Then, use the green triangle (triangle symbol) to shade the area representing consumer surplus in equilibrium. Finally, use...
Consider the Bolivian market for lemons. The following graph shows the domestic demand and domestic supply...
 Consider the Bolivian market for lemons. The following graph shows the domestic demand and domestic supply curves for lemons in Bolivia. Suppose Bolivia's government currently does not allow international trade in lemons. Use the black point (plus symbol) to indicate the equilibrium price of a ton of lemons and the equilibrium quantity of lemons in Bolivia in the absence of international trade. Then, use the green triangle (triangle symbol) to shade the area representing consumer surplus in equilibrium. Finally, use...
Consider the Guatemalan market for tangerines. The following graph shows the domestic demand and domestic supply...
 Consider the Guatemalan market for tangerines. The following graph shows the domestic demand and domestic supply curves for tangerines in Guatemala. Suppose Guatemala's government currently does not allow international trade in tangerines Use the black point (plus symbol) to indicate the equilibrium price of a ton of tangerines and the equilibrium quantity of tangerines in Guatemala in the absence of international trade. Then, use the green triangle (triangle symbol) to shade the area representing consumer surplus in equilibrium. Finally, use...
The following graph shows the domestic demand and domestic supply curves for tangerines in Panama. Suppose...
 The following graph shows the domestic demand and domestic supply curves for tangerines in Panama. Suppose Panama's government currently does not allow international trade in tangerines. Use the black point (plus symbol) to indicate the equilibrium price of a ton of tangerines and the equilibrium quantity of tangerines in Panama in the absence of international trade. Then, use the green triangle (triangle symbol) to shade the area representing consumer surplus in equilibrium. Finally, use the purple triangle (diamond symbol) to...
Consider the Colombian market for soybeans. The following graph shows the domestic demand and domestic supply...
 Consider the Colombian market for soybeans. The following graph shows the domestic demand and domestic supply curves for soybeans in Colombia. Suppose Colombia's government currently does not allow international trade in soybeans. Use the black point (plus symbol) to indicate the equilibrium price of a ton of soybeans and the equilibrium quantity of soybeans in Colombia in the absence of international trade. Then, use the green triangle (triangle symbol) to shade the area representing consumer surplus in equilibrium. Finally, use...
 3. Consumer Surplus and Producer Surplus from Market
Exchange
Consider the Zambian market for oranges.
The following graph shows the domestic demand and domestic
supply curves for oranges in Zambia. Suppose Zambia's government
currently does not allow the international trade in oranges.
Use the black point (plus symbol) to indicate the equilibrium
price of a ton of oranges and the equilibrium quantity of oranges
in Zambia in the absence of international trade. Then, use the
green point (triangle symbol) to...
3. Consumer Surplus and Producer Surplus from Market
Exchange
Consider the Zambian market for oranges.
The following graph shows the domestic demand and domestic
supply curves for oranges in Zambia. Suppose Zambia's government
currently does not allow the international trade in oranges.
Use the black point (plus symbol) to indicate the equilibrium
price of a ton of oranges and the equilibrium quantity of oranges
in Zambia in the absence of international trade. Then, use the
green point (triangle symbol) to...
 First, use the black point (plus symbol) to indicate the equilibrium price and quantity of mountain bikes in the absence of a tax. Then use the green point (triangle symbol) to shade the area representing total consumer surplus (CS) at the equilibrium price. Next, use the purple point (diamond symbol) to shade the area representing total producer surplus (PS) at the equilibrium price. Before Tax Equilibrium Consumer Surplus PRICE (Dollars per bike) Producer Surplus CENGAGE MINDTAP Q Search this course...
 Aplia Homework: International Trade 3. Welfare effects of a tariff in a small country Suppose Zambia is open to free trade in the world market for soybeans. Because of Zambia's small size, the demand for and supply of soybeans in Zambia do not affect the world price. The following graph shows the domestic soybeans market in Zambia. The world price of soybeans is Pw-$400 per ton On the following graph, use the green triangle (triangle symbols) to shade the area...
 fill in the blanks
1)increase/decrease
2)increase/decrease
3)gain/loss
Consider the Sudanese market for tangerines. The following graph shows the domestic demand and domestic supply curves for tangerines in Sudan. Suppose Sudan's government currently does not allow international trade in tangerines. Use the black point (plus symbol) to indicate the equilibrium price of a ton of tangerines and the equilibrium quantity of tangerines in Sudan in the absence of international trade. Then, use the green triangle (triangle symbol) to shade the area...
fill in the blanks
1)increase/decrease
2)increase/decrease
3)gain/loss
Consider the Sudanese market for tangerines. The following graph shows the domestic demand and domestic supply curves for tangerines in Sudan. Suppose Sudan's government currently does not allow international trade in tangerines. Use the black point (plus symbol) to indicate the equilibrium price of a ton of tangerines and the equilibrium quantity of tangerines in Sudan in the absence of international trade. Then, use the green triangle (triangle symbol) to shade the area...
 Consider the Sudanese market for tangerines The following graph shows the domestic demand and domestic supply curves for tangerines in Sudan. Suppose Sudan's government currently does not allow international trade in tangerines Use the black point (plus symbol) to indicate the equilibrium price of a ton of tangerines and the equilibrium quantity of tangerines in Sudan in the absence of international trade. Then, use the green triangle (triangle symbol) to shade the area representing consumer surplus in equilibrium. Finally, use...
 Consider the Bolivian market for lemons. The following graph shows the domestic demand and domestic supply curves for lemons in Bolivia. Suppose Bolivia's government currently does not allow international trade in lemons. Use the black point (plus symbol) to indicate the equilibrium price of a ton of lemons and the equilibrium quantity of lemons in Bolivia in the absence of international trade. Then, use the green triangle (triangle symbol) to shade the area representing consumer surplus in equilibrium. Finally, use...
 Consider the Guatemalan market for tangerines. The following graph shows the domestic demand and domestic supply curves for tangerines in Guatemala. Suppose Guatemala's government currently does not allow international trade in tangerines Use the black point (plus symbol) to indicate the equilibrium price of a ton of tangerines and the equilibrium quantity of tangerines in Guatemala in the absence of international trade. Then, use the green triangle (triangle symbol) to shade the area representing consumer surplus in equilibrium. Finally, use...
 The following graph shows the domestic demand and domestic supply curves for tangerines in Panama. Suppose Panama's government currently does not allow international trade in tangerines. Use the black point (plus symbol) to indicate the equilibrium price of a ton of tangerines and the equilibrium quantity of tangerines in Panama in the absence of international trade. Then, use the green triangle (triangle symbol) to shade the area representing consumer surplus in equilibrium. Finally, use the purple triangle (diamond symbol) to...
 Consider the Colombian market for soybeans. The following graph shows the domestic demand and domestic supply curves for soybeans in Colombia. Suppose Colombia's government currently does not allow international trade in soybeans. Use the black point (plus symbol) to indicate the equilibrium price of a ton of soybeans and the equilibrium quantity of soybeans in Colombia in the absence of international trade. Then, use the green triangle (triangle symbol) to shade the area representing consumer surplus in equilibrium. Finally, use...
Most questions answered within 3 hours.
-
Where is the error in this code sequence?
String s1 = "Hello";
String s2 = "ello";...
asked 10 months ago -
Financial data for Joel de Paris, Inc., for last year
follow:
Joel de Paris, Inc.
Balance...
asked 10 months ago -
Consider this reaction:
Al2(SO4)3 (aq)+ BaCl3
(aq) Al2Cl6 (aq)- +
3BaSO4(s) . What is the...
asked 10 months ago -
Suppose that Savneet is considering increasing her
recent random sample from 20 car rentals to 40...
asked 10 months ago -
Trucks arrive at an unloading terminal at an average rate of 120
per hour.
Trucks arrive...
asked 10 months ago -
Why are methanol and ethanol completely soluble in water while
octanol is not very little soluble....
asked 10 months ago -
A facilities manager at a university reads in a research report
that the mean amount of...
asked 10 months ago -
When the CuSO4 is rehydrated by adding water to the anhydrous
compound, is this an endothermic...
asked 10 months ago -
A ray of sunlight is passing from diamond into crown glass; the
angle of incidence is...
asked 10 months ago -
A block of mass 0.249 kg is placed on top of a light, vertical
spring of...
asked 10 months ago -
how do the kidneys compensate in the presences of acidosis
a) trigger hyperventilate
b) reserve acid...
asked 10 months ago -
Question 501 pts
The rental rate of capital to the firm increases. Which of the
following...
asked 10 months ago