
Please help me understand how the answer to this question is B using formulas or a financial calculator if applicable.
Homework Answers
Add Answer to:
Please help me understand how the answer to this question is B
using formulas or a...
11. A zero coupon bond is selling for $476. The bond has a face value of...
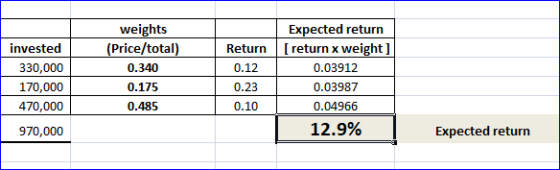
 11. A zero coupon bond is selling for $476. The bond has a face value of $1,000 and matures in 8 years. Your friend asks you if he should buy the bond. He tells you his required return is 9 percent. Would you recommend he buy the bond or not? Explain your answer. 12. Assume that you have $330.000 invested in a stock that is retuming 11.50%, $170,000 invested in a stock that is returning 22.75%, and $470,000 invested in...
Please help me understand how to come to the answer above using formulas or a financial...
 Please help me understand how to come to the answer above using
formulas or a financial calculator if possible. Thanks.
6. Answer the questions below using the following information on stocks A, B, and C. Expected Return Standard Deviation Beta A 20% 12% 1.8 21% 10% 2.2 10% 10% 0.8 Assume the risk-free rate of return is 3% and the expected market return is 12%. If returns are normally distributed, then approximately two-thirds of the time the return on each...
Please help me understand how to come to the answer above using
formulas or a financial calculator if possible. Thanks.
6. Answer the questions below using the following information on stocks A, B, and C. Expected Return Standard Deviation Beta A 20% 12% 1.8 21% 10% 2.2 10% 10% 0.8 Assume the risk-free rate of return is 3% and the expected market return is 12%. If returns are normally distributed, then approximately two-thirds of the time the return on each...
Please help me understand how the answer is C showing work using formulas or financial calculator....
 Please help me understand how the answer is C showing work using
formulas or financial calculator. Thanks.
9. Assume that you expect to hold a $20,000 investment for one year. It is forecasted to have a year end value of $21,000 with a 30% probability; a year end value of $24,000 with a 45% probability; and a year end value of $30,000 with a 25% probability. What is the standard deviation of the holding period return for this investment? A)...
Please help me understand how the answer is C showing work using
formulas or financial calculator. Thanks.
9. Assume that you expect to hold a $20,000 investment for one year. It is forecasted to have a year end value of $21,000 with a 30% probability; a year end value of $24,000 with a 45% probability; and a year end value of $30,000 with a 25% probability. What is the standard deviation of the holding period return for this investment? A)...
Please answer and walk me through all of the questions. 1. You are considering investing in...
 Please answer and
walk me through all of the questions.
1. You are considering investing in a single stock that has a 50% chance of producing a 20% return. a 25% chance of producing an 8% return, and a 25% chance of producing a-12% return, what is its expected return? Expected r Consider the range of the possible returns for this stock and draw a picture of the dispersion of possible returns. 2. Expected Return on a Portfolio Stock Wtd...
Please answer and
walk me through all of the questions.
1. You are considering investing in a single stock that has a 50% chance of producing a 20% return. a 25% chance of producing an 8% return, and a 25% chance of producing a-12% return, what is its expected return? Expected r Consider the range of the possible returns for this stock and draw a picture of the dispersion of possible returns. 2. Expected Return on a Portfolio Stock Wtd...
help me with this please no excel please 15. Use the following information to answer the...
 help me with this please no excel please
15. Use the following information to answer the question below. o Year 2008 2009 2010 2011 Risk-free Return 1.75% 1.25% 1.25% 1.50% Market Return 7.50% -30.00% 9.50% 11.50% PE-Waters Return 4.50% -31.50% 6.00% 5.50% B, = 6.47826) Bez 1.048 B3:0.57577 Bu -0.4 Using the historical average excess retums and historical volatilities of both PE- Waters and Market portfolio that you can calculate from the information above. your estimate of PE-Waters' Beta is...
help me with this please no excel please
15. Use the following information to answer the question below. o Year 2008 2009 2010 2011 Risk-free Return 1.75% 1.25% 1.25% 1.50% Market Return 7.50% -30.00% 9.50% 11.50% PE-Waters Return 4.50% -31.50% 6.00% 5.50% B, = 6.47826) Bez 1.048 B3:0.57577 Bu -0.4 Using the historical average excess retums and historical volatilities of both PE- Waters and Market portfolio that you can calculate from the information above. your estimate of PE-Waters' Beta is...
Answer all questions and show work using hand formulas only. Do NOT answer the question if...
 Answer all questions and show work using hand formulas only. Do
NOT answer the question if you cannot answer everything.
1.
2.
3.
TABLE 5.3 Risk and return of investments in major asset classes, 1927-2016 T-bills T-bonds Stocks Arithmetic average Risk premium Standard deviation max min 3.42 N/A 3.14 14.71 -0.02 5.51 2.08 8.14 38.07 -8.47 11.91 8.48 19.99 56.38 -43.73 Using Table 5.3 as your guide, what is your estimate of the expected annual HPR on the market index...
Answer all questions and show work using hand formulas only. Do
NOT answer the question if you cannot answer everything.
1.
2.
3.
TABLE 5.3 Risk and return of investments in major asset classes, 1927-2016 T-bills T-bonds Stocks Arithmetic average Risk premium Standard deviation max min 3.42 N/A 3.14 14.71 -0.02 5.51 2.08 8.14 38.07 -8.47 11.91 8.48 19.99 56.38 -43.73 Using Table 5.3 as your guide, what is your estimate of the expected annual HPR on the market index...
Please help me to solve part c of the question (prediction interval) by using any software "or" R...
 Please help me to solve part c of the question
(prediction interval) by using any software "or" R "or" Minitab
(whatever technology you want to use you can use to solve this
part).
ent store are shown (in hundreds of thousands of dollars) in the table below for a Retail sales in quarters 1-4 over a 10-year 25.8 27.7 27.3 31.3 22.8 24.6 24.8 28.1 20.5 23.6 20.8 28.3 19.1 19.5 19.4 25 Year Quarter 1 Quarter 2 Quarter3 Quarter...
Please help me to solve part c of the question
(prediction interval) by using any software "or" R "or" Minitab
(whatever technology you want to use you can use to solve this
part).
ent store are shown (in hundreds of thousands of dollars) in the table below for a Retail sales in quarters 1-4 over a 10-year 25.8 27.7 27.3 31.3 22.8 24.6 24.8 28.1 20.5 23.6 20.8 28.3 19.1 19.5 19.4 25 Year Quarter 1 Quarter 2 Quarter3 Quarter...
Can you please help me figure out how the answer is B using a formula. 14....
 Can you please help me figure out how the answer is B using a
formula.
14. Over the last 5 years, the average nominal rate of return of 90 day Treasury bills was 1.02%, Saltine Co.'s average nominal stock return was 8.9%, large company stocks average nominal return was 15%, and the inflation rate averaged 2.7%. The real rate of Saltine's stock return is A) 6.8%. B) 6.0%. C) 5.1%. D) 4.3%. Answer: B
Can you please help me figure out how the answer is B using a
formula.
14. Over the last 5 years, the average nominal rate of return of 90 day Treasury bills was 1.02%, Saltine Co.'s average nominal stock return was 8.9%, large company stocks average nominal return was 15%, and the inflation rate averaged 2.7%. The real rate of Saltine's stock return is A) 6.8%. B) 6.0%. C) 5.1%. D) 4.3%. Answer: B
Can you please show me (step by step) how to solve? 9. You bought one of...
Can you please show me (step by step) how to solve? 9. You bought one of Great White Shark Repellant Co.’s 5.8 percent coupon bonds one year ago for $1,030. These bonds make annual payments and mature 14 years from now. Suppose you decide to sell your bonds today, when the required return on the bonds is 5.1 percent. If the inflation rate was 3.9 percent over the past year, what was your total real return on investment? 10. A...
Hi there! can you please help me answer these questions with steps so I understand how...
 Hi there! can you please help me answer these questions with
steps so I understand how you answered them. This is math
statistics, thank you in advance!!
Below are the annual numbers of deaths from tornados in the United States from 1998 to 2016. 23 17 40 40 245 54 35 38 67 81 125 21 65 78 82 95 54 190 69 a) Using your graphing calculator, enter the data into L1. Then go to STAT- CALC- 1-Var Stats...
Hi there! can you please help me answer these questions with
steps so I understand how you answered them. This is math
statistics, thank you in advance!!
Below are the annual numbers of deaths from tornados in the United States from 1998 to 2016. 23 17 40 40 245 54 35 38 67 81 125 21 65 78 82 95 54 190 69 a) Using your graphing calculator, enter the data into L1. Then go to STAT- CALC- 1-Var Stats...
 11. A zero coupon bond is selling for $476. The bond has a face value of $1,000 and matures in 8 years. Your friend asks you if he should buy the bond. He tells you his required return is 9 percent. Would you recommend he buy the bond or not? Explain your answer. 12. Assume that you have $330.000 invested in a stock that is retuming 11.50%, $170,000 invested in a stock that is returning 22.75%, and $470,000 invested in...
 Please help me understand how to come to the answer above using
formulas or a financial calculator if possible. Thanks.
6. Answer the questions below using the following information on stocks A, B, and C. Expected Return Standard Deviation Beta A 20% 12% 1.8 21% 10% 2.2 10% 10% 0.8 Assume the risk-free rate of return is 3% and the expected market return is 12%. If returns are normally distributed, then approximately two-thirds of the time the return on each...
Please help me understand how to come to the answer above using
formulas or a financial calculator if possible. Thanks.
6. Answer the questions below using the following information on stocks A, B, and C. Expected Return Standard Deviation Beta A 20% 12% 1.8 21% 10% 2.2 10% 10% 0.8 Assume the risk-free rate of return is 3% and the expected market return is 12%. If returns are normally distributed, then approximately two-thirds of the time the return on each...
 Please help me understand how the answer is C showing work using
formulas or financial calculator. Thanks.
9. Assume that you expect to hold a $20,000 investment for one year. It is forecasted to have a year end value of $21,000 with a 30% probability; a year end value of $24,000 with a 45% probability; and a year end value of $30,000 with a 25% probability. What is the standard deviation of the holding period return for this investment? A)...
Please help me understand how the answer is C showing work using
formulas or financial calculator. Thanks.
9. Assume that you expect to hold a $20,000 investment for one year. It is forecasted to have a year end value of $21,000 with a 30% probability; a year end value of $24,000 with a 45% probability; and a year end value of $30,000 with a 25% probability. What is the standard deviation of the holding period return for this investment? A)...
 Please answer and
walk me through all of the questions.
1. You are considering investing in a single stock that has a 50% chance of producing a 20% return. a 25% chance of producing an 8% return, and a 25% chance of producing a-12% return, what is its expected return? Expected r Consider the range of the possible returns for this stock and draw a picture of the dispersion of possible returns. 2. Expected Return on a Portfolio Stock Wtd...
Please answer and
walk me through all of the questions.
1. You are considering investing in a single stock that has a 50% chance of producing a 20% return. a 25% chance of producing an 8% return, and a 25% chance of producing a-12% return, what is its expected return? Expected r Consider the range of the possible returns for this stock and draw a picture of the dispersion of possible returns. 2. Expected Return on a Portfolio Stock Wtd...
 help me with this please no excel please
15. Use the following information to answer the question below. o Year 2008 2009 2010 2011 Risk-free Return 1.75% 1.25% 1.25% 1.50% Market Return 7.50% -30.00% 9.50% 11.50% PE-Waters Return 4.50% -31.50% 6.00% 5.50% B, = 6.47826) Bez 1.048 B3:0.57577 Bu -0.4 Using the historical average excess retums and historical volatilities of both PE- Waters and Market portfolio that you can calculate from the information above. your estimate of PE-Waters' Beta is...
help me with this please no excel please
15. Use the following information to answer the question below. o Year 2008 2009 2010 2011 Risk-free Return 1.75% 1.25% 1.25% 1.50% Market Return 7.50% -30.00% 9.50% 11.50% PE-Waters Return 4.50% -31.50% 6.00% 5.50% B, = 6.47826) Bez 1.048 B3:0.57577 Bu -0.4 Using the historical average excess retums and historical volatilities of both PE- Waters and Market portfolio that you can calculate from the information above. your estimate of PE-Waters' Beta is...
 Answer all questions and show work using hand formulas only. Do
NOT answer the question if you cannot answer everything.
1.
2.
3.
TABLE 5.3 Risk and return of investments in major asset classes, 1927-2016 T-bills T-bonds Stocks Arithmetic average Risk premium Standard deviation max min 3.42 N/A 3.14 14.71 -0.02 5.51 2.08 8.14 38.07 -8.47 11.91 8.48 19.99 56.38 -43.73 Using Table 5.3 as your guide, what is your estimate of the expected annual HPR on the market index...
Answer all questions and show work using hand formulas only. Do
NOT answer the question if you cannot answer everything.
1.
2.
3.
TABLE 5.3 Risk and return of investments in major asset classes, 1927-2016 T-bills T-bonds Stocks Arithmetic average Risk premium Standard deviation max min 3.42 N/A 3.14 14.71 -0.02 5.51 2.08 8.14 38.07 -8.47 11.91 8.48 19.99 56.38 -43.73 Using Table 5.3 as your guide, what is your estimate of the expected annual HPR on the market index...
 Please help me to solve part c of the question
(prediction interval) by using any software "or" R "or" Minitab
(whatever technology you want to use you can use to solve this
part).
ent store are shown (in hundreds of thousands of dollars) in the table below for a Retail sales in quarters 1-4 over a 10-year 25.8 27.7 27.3 31.3 22.8 24.6 24.8 28.1 20.5 23.6 20.8 28.3 19.1 19.5 19.4 25 Year Quarter 1 Quarter 2 Quarter3 Quarter...
Please help me to solve part c of the question
(prediction interval) by using any software "or" R "or" Minitab
(whatever technology you want to use you can use to solve this
part).
ent store are shown (in hundreds of thousands of dollars) in the table below for a Retail sales in quarters 1-4 over a 10-year 25.8 27.7 27.3 31.3 22.8 24.6 24.8 28.1 20.5 23.6 20.8 28.3 19.1 19.5 19.4 25 Year Quarter 1 Quarter 2 Quarter3 Quarter...
 Can you please help me figure out how the answer is B using a
formula.
14. Over the last 5 years, the average nominal rate of return of 90 day Treasury bills was 1.02%, Saltine Co.'s average nominal stock return was 8.9%, large company stocks average nominal return was 15%, and the inflation rate averaged 2.7%. The real rate of Saltine's stock return is A) 6.8%. B) 6.0%. C) 5.1%. D) 4.3%. Answer: B
Can you please help me figure out how the answer is B using a
formula.
14. Over the last 5 years, the average nominal rate of return of 90 day Treasury bills was 1.02%, Saltine Co.'s average nominal stock return was 8.9%, large company stocks average nominal return was 15%, and the inflation rate averaged 2.7%. The real rate of Saltine's stock return is A) 6.8%. B) 6.0%. C) 5.1%. D) 4.3%. Answer: B
 Hi there! can you please help me answer these questions with
steps so I understand how you answered them. This is math
statistics, thank you in advance!!
Below are the annual numbers of deaths from tornados in the United States from 1998 to 2016. 23 17 40 40 245 54 35 38 67 81 125 21 65 78 82 95 54 190 69 a) Using your graphing calculator, enter the data into L1. Then go to STAT- CALC- 1-Var Stats...
Hi there! can you please help me answer these questions with
steps so I understand how you answered them. This is math
statistics, thank you in advance!!
Below are the annual numbers of deaths from tornados in the United States from 1998 to 2016. 23 17 40 40 245 54 35 38 67 81 125 21 65 78 82 95 54 190 69 a) Using your graphing calculator, enter the data into L1. Then go to STAT- CALC- 1-Var Stats...
Most questions answered within 3 hours.
-
Where is the error in this code sequence?
String s1 = "Hello";
String s2 = "ello";...
asked 10 months ago -
Financial data for Joel de Paris, Inc., for last year
follow:
Joel de Paris, Inc.
Balance...
asked 10 months ago -
Consider this reaction:
Al2(SO4)3 (aq)+ BaCl3
(aq) Al2Cl6 (aq)- +
3BaSO4(s) . What is the...
asked 10 months ago -
Suppose that Savneet is considering increasing her
recent random sample from 20 car rentals to 40...
asked 10 months ago -
Trucks arrive at an unloading terminal at an average rate of 120
per hour.
Trucks arrive...
asked 10 months ago -
Why are methanol and ethanol completely soluble in water while
octanol is not very little soluble....
asked 10 months ago -
A facilities manager at a university reads in a research report
that the mean amount of...
asked 10 months ago -
When the CuSO4 is rehydrated by adding water to the anhydrous
compound, is this an endothermic...
asked 10 months ago -
A ray of sunlight is passing from diamond into crown glass; the
angle of incidence is...
asked 10 months ago -
A block of mass 0.249 kg is placed on top of a light, vertical
spring of...
asked 10 months ago -
how do the kidneys compensate in the presences of acidosis
a) trigger hyperventilate
b) reserve acid...
asked 10 months ago -
Question 501 pts
The rental rate of capital to the firm increases. Which of the
following...
asked 10 months ago