


Homework Answers
please note that those formulas which uses average balance in calculation , ending balance have been considered as no information relating to 2017 was available.
| return on assets | net income / total assets | |
| 2019 ($ millions) | 2018 ($ millions) | |
| net income | 514405 | 500343 |
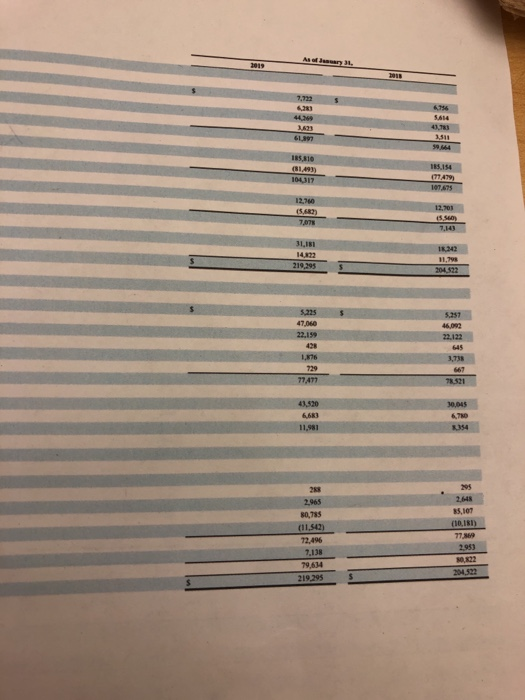
| total assets | 219295 | 204522 |
| return on assets | 2.35 | 2.45 |
| return on equity | net income / shareholders equity | |
| 2019 ($ millions) | 2018 ($ millions) | |
| net income | 514405 | 500343 |
| shareholders equity | 72496 | 77869 |
| return on equity | 7.10 | 6.43 |
| gross profit margin | (sales - cost of sales)/sales *100 | |
| 2019 ($ millions) | 2018 ($ millions) | |
| net sales | 510329 | 495761 |
| cost of sales | 385301 | 373396 |
| gross profit margin | 24.50% | 24.68% |
| quick ratio | quick assets / total current liabilities | |
| 2019 ($ millions) | 2018 ($ millions) | |
| cash | 7722 | 6756 |
| receivable | 6283 | 5614 |
| quick assets | 14005 | 12370 |
| total current liabilities | 77477 | 78521 |
| quick ratio | 0.18 | 0.16 |
| debt to equity ratio | total liabilities / shareholders equity | |
| 2019 ($ millions) | 2018 ($ millions) | |
| total liabilities | 139661 | 123700 |
| shareholders equity | 72496 | 77869 |
| debt to equity ratio | 1.93 | 1.59 |
| inventory turnover | cost of goods sold / ending inventory | |
| 2019 ($ millions) | 2018 ($ millions) | |
| cost of sales | 385301 | 373396 |
| ending inventory | 44269 | 43783 |
| inventory turnover | 8.70 | 8.53 |
Add Answer to:
calculate
ROA
ROE
gross profit margin
quick ratio
debt to equity ratio
inventory turnover
calculate 2018...
income statement Please solve debt management ratio and profitabilty ratio also explain what you did for...
 income statement
Please solve debt management ratio and profitabilty ratio also
explain what you did
for
2019
Walmart Inc. Consolidated Statements of Income Fiscal Years Eaded January 31, 2018 2017 2019 s 510,329 $ 4,076 514,405 495,761 S 4,582 500,343 481,317 4556 485,873 385,301 107,147 21,957 373,396 106,510 20,437 361 256 101 853 22,764 (Amount in millions, cept per share data) Revenues: Net sales Membership and other income Total revenues Costs and expenses: Cost of sales Operating, selling general and...
income statement
Please solve debt management ratio and profitabilty ratio also
explain what you did
for
2019
Walmart Inc. Consolidated Statements of Income Fiscal Years Eaded January 31, 2018 2017 2019 s 510,329 $ 4,076 514,405 495,761 S 4,582 500,343 481,317 4556 485,873 385,301 107,147 21,957 373,396 106,510 20,437 361 256 101 853 22,764 (Amount in millions, cept per share data) Revenues: Net sales Membership and other income Total revenues Costs and expenses: Cost of sales Operating, selling general and...
12 Months Ended Consolidated Statements of Income - USD ($) shares in Millions, $ in Millions...
 12 Months Ended Consolidated Statements of Income - USD ($) shares in Millions, $ in Millions Jan. 31, Jan. 31, You Must Use Excel Formulas in Yellow Boxes 2018 2017 Revenues: Horizontal Horizontal Dollar Value Percent $495,761 $481,317 Net sales Membership and other income 4,582 4,556 Total revenues 500,343 485,873 Costs and expenses: Cost of sales Gross Profit Operating, selling, general and 373,396 361,256 126,947 124,617 106,510 101,853 administrative expenses 20,437 22,764 Operating income Interest: Debt Capital lease and financing...
12 Months Ended Consolidated Statements of Income - USD ($) shares in Millions, $ in Millions...
 12 Months Ended Consolidated Statements of Income - USD ($) shares in Millions, $ in Millions Jan. 31, 2018 Jan. 31, 2017 $495,761 4,582 500,343 0 0 $481,317 4 ,556 0 485,873 373,396 106,510 0 o 361,256 101,853 20,437 22,764 Revenues: Net sales Membership and other income Total revenues Costs and expenses: Cost of sales Operating, selling, general and administrative expenses 0 Operating income 1 Interest: 2 Debt 3 Capital lease and financing obligations 4 Interest income 5 Interest, net...
12 Months Ended Consolidated Statements of Income - USD ($) shares in Millions, $ in Millions...
 12 Months Ended Consolidated Statements of Income - USD ($) shares in Millions, $ in Millions Jan. 31, 2018 Jan. 31, 2017 $ 495,761 4,582 500,343 0 $ 481,317 0 4,556 0 485,873 373,396 106,510 0 0 361,256 101,853 20,437 o 22,764 3Revenues: Net sales 5 Membership and other income 5 Total revenues Costs and expenses: Cost of sales Operating, selling, general and administrative expenses 10 Operating income 11 Interest: -2 Debt 3 Capital lease and financing obligations 4 Interest...
12 Months Ended Consolidated Statements of Income - USD ($) shares in Millions, $ in Millions...
 12 Months Ended Consolidated Statements of Income - USD ($) shares in Millions, $ in Millions Jan. 31, 2018 Jan. 31, 2017 99.08% 0 $ 495,761 4,582 500,343 $ 481,317 4,556 485,873 99.06% 0.94% 0 373,396 106,510 0 o 361,256 101,853 20,437 22,764 3 Revenues: 4 Net sales 5 Membership and other income 6 Total revenues 7 Costs and expenses: 8 Cost of sales Operating, selling, general and administrative 9 expenses 10 Operating income 11 Interest: 12 Debt 13 Capital...
2019 2018 2017 Dollar Change Dollar Ch $ $ S S Millions Assets Curent Assets: Cash...
 2019 2018 2017 Dollar Change Dollar Ch $ $ S S Millions Assets Curent Assets: Cash and cash equivalents Accounts receivable, net Inventories Prepaid expenses and other Total current assets Property and equipment: Property and equipment Less: Accumulated Depreciation Property and Equipment, net Property under Capital lease and fianancing obligations, net: Property under Capital lease and financing obligations Less: Accumulated amortization Property under capital lease and financing obligations, net. 7,722 6,283 44,269 3,623 61,897 6,756 5,614 43,783 3,511 59,664 6,867...
Current ratio Quick ratio Debt to equity ratio Times interest earned ratio Receivables turnover rati...
 Current ratio
Quick ratio
Debt to equity ratio
Times interest earned ratio
Receivables turnover ratio
Average collection period
Inventory turnover ratio
Average days inventory held
Payables turnover ratio
Average days payables outstanding
Asset turnover ratio
Profit margin on sales
Return on assets (ROA)
Return on shareholders' equity (ROE)
To calculate the above statement using the following
material:
FORD MOTOR COMPANY AND SUBSIDIARIES CONSOLIDATED BALANCE SHEET (in millions) December 31 2018 December 31 2017 ASSETS Cash and cash equivalents (Note 9)...
Current ratio
Quick ratio
Debt to equity ratio
Times interest earned ratio
Receivables turnover ratio
Average collection period
Inventory turnover ratio
Average days inventory held
Payables turnover ratio
Average days payables outstanding
Asset turnover ratio
Profit margin on sales
Return on assets (ROA)
Return on shareholders' equity (ROE)
To calculate the above statement using the following
material:
FORD MOTOR COMPANY AND SUBSIDIARIES CONSOLIDATED BALANCE SHEET (in millions) December 31 2018 December 31 2017 ASSETS Cash and cash equivalents (Note 9)...
calculate the following financial indicators Current Ratio Debt/Equity Ratio Free Cash Flow Earnings...
 calculate the following financial
indicators
Current Ratio
Debt/Equity Ratio
Free Cash Flow
Earnings per Share
Price/Earnings Ratio
Return on Equity
Net Profit Margin
As Reported Annual Income Statement Report Date Currency Audit Status Consolidated Scale Net product sales Net services sales Total net sales Cost of sales Fulfillment expenses Marketing expenses Technology & content expenses General & administrative expenses Other operating expense (income), net Total operating expenses & costs Income from operations Interest income Interest expense...
calculate the following financial
indicators
Current Ratio
Debt/Equity Ratio
Free Cash Flow
Earnings per Share
Price/Earnings Ratio
Return on Equity
Net Profit Margin
As Reported Annual Income Statement Report Date Currency Audit Status Consolidated Scale Net product sales Net services sales Total net sales Cost of sales Fulfillment expenses Marketing expenses Technology & content expenses General & administrative expenses Other operating expense (income), net Total operating expenses & costs Income from operations Interest income Interest expense...
I need some help with this problem. please show work. many thanks Walmart Ine. Consolidated Statements...
 I need some help with this problem. please show work.
many thanks
Walmart Ine. Consolidated Statements of Income Fiscal Years Euded January 31, 2018 2019 2017 (Amounts in mtllions, axrapt per share data) Reveaues: 495,761 $10.329 481317 Net sales 4.076 4,582 4,556 Membership and ober incomse 435,873 514.405 500,343 Total ieveues Costs and expeases: 361 256 Cost of sales 373,396 385.301 101.853 Operating, selling, geseral and administrative esspenses 107,147 106,510 22.764 Operating income 20.437 21.957 Interest: Debe 1,978 2.044 1.975...
I need some help with this problem. please show work.
many thanks
Walmart Ine. Consolidated Statements of Income Fiscal Years Euded January 31, 2018 2019 2017 (Amounts in mtllions, axrapt per share data) Reveaues: 495,761 $10.329 481317 Net sales 4.076 4,582 4,556 Membership and ober incomse 435,873 514.405 500,343 Total ieveues Costs and expeases: 361 256 Cost of sales 373,396 385.301 101.853 Operating, selling, geseral and administrative esspenses 107,147 106,510 22.764 Operating income 20.437 21.957 Interest: Debe 1,978 2.044 1.975...
AR inancial Statements: Wal-Mart Stores, Inc. ores, Inc.'s financial statements as presented in the company's 2016...
 AR inancial Statements: Wal-Mart Stores, Inc. ores, Inc.'s financial statements as presented in the company's 2016 annual report. The complete annual report, including notes to site. Consolidated Statements of Income Facal than inded onuary at 2016 2015 2014 Revenues Neties Membership and other income Total revenues Costs and expenses 547 614 3,516 82110 70 3.218 06.294 5651 Operating ng general and administrave expenses Operating income 10084 97,041 24,105 93418 27.147 97253 26,82 2027 2161 Capital lease and financing obligations 2,467...
 income statement
Please solve debt management ratio and profitabilty ratio also
explain what you did
for
2019
Walmart Inc. Consolidated Statements of Income Fiscal Years Eaded January 31, 2018 2017 2019 s 510,329 $ 4,076 514,405 495,761 S 4,582 500,343 481,317 4556 485,873 385,301 107,147 21,957 373,396 106,510 20,437 361 256 101 853 22,764 (Amount in millions, cept per share data) Revenues: Net sales Membership and other income Total revenues Costs and expenses: Cost of sales Operating, selling general and...
income statement
Please solve debt management ratio and profitabilty ratio also
explain what you did
for
2019
Walmart Inc. Consolidated Statements of Income Fiscal Years Eaded January 31, 2018 2017 2019 s 510,329 $ 4,076 514,405 495,761 S 4,582 500,343 481,317 4556 485,873 385,301 107,147 21,957 373,396 106,510 20,437 361 256 101 853 22,764 (Amount in millions, cept per share data) Revenues: Net sales Membership and other income Total revenues Costs and expenses: Cost of sales Operating, selling general and...
 12 Months Ended Consolidated Statements of Income - USD ($) shares in Millions, $ in Millions Jan. 31, Jan. 31, You Must Use Excel Formulas in Yellow Boxes 2018 2017 Revenues: Horizontal Horizontal Dollar Value Percent $495,761 $481,317 Net sales Membership and other income 4,582 4,556 Total revenues 500,343 485,873 Costs and expenses: Cost of sales Gross Profit Operating, selling, general and 373,396 361,256 126,947 124,617 106,510 101,853 administrative expenses 20,437 22,764 Operating income Interest: Debt Capital lease and financing...
 12 Months Ended Consolidated Statements of Income - USD ($) shares in Millions, $ in Millions Jan. 31, 2018 Jan. 31, 2017 $495,761 4,582 500,343 0 0 $481,317 4 ,556 0 485,873 373,396 106,510 0 o 361,256 101,853 20,437 22,764 Revenues: Net sales Membership and other income Total revenues Costs and expenses: Cost of sales Operating, selling, general and administrative expenses 0 Operating income 1 Interest: 2 Debt 3 Capital lease and financing obligations 4 Interest income 5 Interest, net...
 12 Months Ended Consolidated Statements of Income - USD ($) shares in Millions, $ in Millions Jan. 31, 2018 Jan. 31, 2017 $ 495,761 4,582 500,343 0 $ 481,317 0 4,556 0 485,873 373,396 106,510 0 0 361,256 101,853 20,437 o 22,764 3Revenues: Net sales 5 Membership and other income 5 Total revenues Costs and expenses: Cost of sales Operating, selling, general and administrative expenses 10 Operating income 11 Interest: -2 Debt 3 Capital lease and financing obligations 4 Interest...
 12 Months Ended Consolidated Statements of Income - USD ($) shares in Millions, $ in Millions Jan. 31, 2018 Jan. 31, 2017 99.08% 0 $ 495,761 4,582 500,343 $ 481,317 4,556 485,873 99.06% 0.94% 0 373,396 106,510 0 o 361,256 101,853 20,437 22,764 3 Revenues: 4 Net sales 5 Membership and other income 6 Total revenues 7 Costs and expenses: 8 Cost of sales Operating, selling, general and administrative 9 expenses 10 Operating income 11 Interest: 12 Debt 13 Capital...
 2019 2018 2017 Dollar Change Dollar Ch $ $ S S Millions Assets Curent Assets: Cash and cash equivalents Accounts receivable, net Inventories Prepaid expenses and other Total current assets Property and equipment: Property and equipment Less: Accumulated Depreciation Property and Equipment, net Property under Capital lease and fianancing obligations, net: Property under Capital lease and financing obligations Less: Accumulated amortization Property under capital lease and financing obligations, net. 7,722 6,283 44,269 3,623 61,897 6,756 5,614 43,783 3,511 59,664 6,867...
 Current ratio
Quick ratio
Debt to equity ratio
Times interest earned ratio
Receivables turnover ratio
Average collection period
Inventory turnover ratio
Average days inventory held
Payables turnover ratio
Average days payables outstanding
Asset turnover ratio
Profit margin on sales
Return on assets (ROA)
Return on shareholders' equity (ROE)
To calculate the above statement using the following
material:
FORD MOTOR COMPANY AND SUBSIDIARIES CONSOLIDATED BALANCE SHEET (in millions) December 31 2018 December 31 2017 ASSETS Cash and cash equivalents (Note 9)...
Current ratio
Quick ratio
Debt to equity ratio
Times interest earned ratio
Receivables turnover ratio
Average collection period
Inventory turnover ratio
Average days inventory held
Payables turnover ratio
Average days payables outstanding
Asset turnover ratio
Profit margin on sales
Return on assets (ROA)
Return on shareholders' equity (ROE)
To calculate the above statement using the following
material:
FORD MOTOR COMPANY AND SUBSIDIARIES CONSOLIDATED BALANCE SHEET (in millions) December 31 2018 December 31 2017 ASSETS Cash and cash equivalents (Note 9)...
 calculate the following financial
indicators
Current Ratio
Debt/Equity Ratio
Free Cash Flow
Earnings per Share
Price/Earnings Ratio
Return on Equity
Net Profit Margin
As Reported Annual Income Statement Report Date Currency Audit Status Consolidated Scale Net product sales Net services sales Total net sales Cost of sales Fulfillment expenses Marketing expenses Technology & content expenses General & administrative expenses Other operating expense (income), net Total operating expenses & costs Income from operations Interest income Interest expense...
calculate the following financial
indicators
Current Ratio
Debt/Equity Ratio
Free Cash Flow
Earnings per Share
Price/Earnings Ratio
Return on Equity
Net Profit Margin
As Reported Annual Income Statement Report Date Currency Audit Status Consolidated Scale Net product sales Net services sales Total net sales Cost of sales Fulfillment expenses Marketing expenses Technology & content expenses General & administrative expenses Other operating expense (income), net Total operating expenses & costs Income from operations Interest income Interest expense...
 I need some help with this problem. please show work.
many thanks
Walmart Ine. Consolidated Statements of Income Fiscal Years Euded January 31, 2018 2019 2017 (Amounts in mtllions, axrapt per share data) Reveaues: 495,761 $10.329 481317 Net sales 4.076 4,582 4,556 Membership and ober incomse 435,873 514.405 500,343 Total ieveues Costs and expeases: 361 256 Cost of sales 373,396 385.301 101.853 Operating, selling, geseral and administrative esspenses 107,147 106,510 22.764 Operating income 20.437 21.957 Interest: Debe 1,978 2.044 1.975...
I need some help with this problem. please show work.
many thanks
Walmart Ine. Consolidated Statements of Income Fiscal Years Euded January 31, 2018 2019 2017 (Amounts in mtllions, axrapt per share data) Reveaues: 495,761 $10.329 481317 Net sales 4.076 4,582 4,556 Membership and ober incomse 435,873 514.405 500,343 Total ieveues Costs and expeases: 361 256 Cost of sales 373,396 385.301 101.853 Operating, selling, geseral and administrative esspenses 107,147 106,510 22.764 Operating income 20.437 21.957 Interest: Debe 1,978 2.044 1.975...
 AR inancial Statements: Wal-Mart Stores, Inc. ores, Inc.'s financial statements as presented in the company's 2016 annual report. The complete annual report, including notes to site. Consolidated Statements of Income Facal than inded onuary at 2016 2015 2014 Revenues Neties Membership and other income Total revenues Costs and expenses 547 614 3,516 82110 70 3.218 06.294 5651 Operating ng general and administrave expenses Operating income 10084 97,041 24,105 93418 27.147 97253 26,82 2027 2161 Capital lease and financing obligations 2,467...
Most questions answered within 3 hours.
-
Where is the error in this code sequence?
String s1 = "Hello";
String s2 = "ello";...
asked 10 months ago -
Financial data for Joel de Paris, Inc., for last year
follow:
Joel de Paris, Inc.
Balance...
asked 10 months ago -
Consider this reaction:
Al2(SO4)3 (aq)+ BaCl3
(aq) Al2Cl6 (aq)- +
3BaSO4(s) . What is the...
asked 10 months ago -
Suppose that Savneet is considering increasing her
recent random sample from 20 car rentals to 40...
asked 10 months ago -
Trucks arrive at an unloading terminal at an average rate of 120
per hour.
Trucks arrive...
asked 10 months ago -
Why are methanol and ethanol completely soluble in water while
octanol is not very little soluble....
asked 10 months ago -
A facilities manager at a university reads in a research report
that the mean amount of...
asked 10 months ago -
When the CuSO4 is rehydrated by adding water to the anhydrous
compound, is this an endothermic...
asked 10 months ago -
A ray of sunlight is passing from diamond into crown glass; the
angle of incidence is...
asked 10 months ago -
A block of mass 0.249 kg is placed on top of a light, vertical
spring of...
asked 10 months ago -
how do the kidneys compensate in the presences of acidosis
a) trigger hyperventilate
b) reserve acid...
asked 10 months ago -
Question 501 pts
The rental rate of capital to the firm increases. Which of the
following...
asked 10 months ago