
Homework Answers
Debt ratio
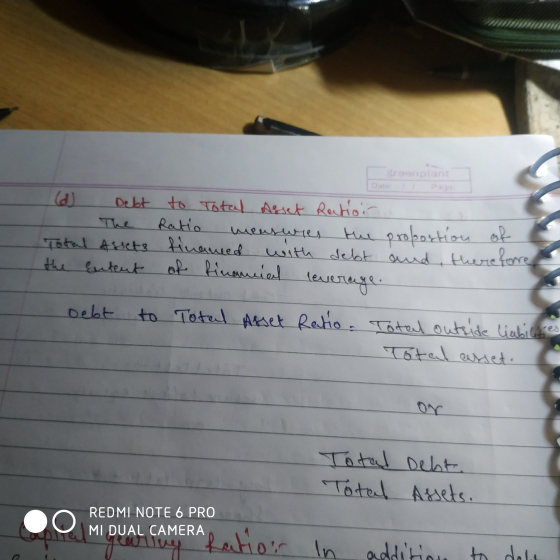
The debt ratio measures the firm's ability to repay long-term debt by indicating the percentage of a company's assets that are provided via debt. Debt ratio = Total debt / Total assets. The higher the ratio, the greater risk will be associated with the firm's operation.
Liquidity ratio
In finance, the quick ratio, also known as the acid-test ratio is a type of liquidity ratio, which measures the ability of a company to use its near cash or quick assets to extinguish or retire its current liabilities
 GOOD
QUESTION
GOOD
QUESTION
THANKS
Add Answer to:
income statement
Please solve debt management ratio and profitabilty ratio also
explain what you did
for...
calculate ROA ROE gross profit margin quick ratio debt to equity ratio inventory turnover calculate 2018...
 calculate
ROA
ROE
gross profit margin
quick ratio
debt to equity ratio
inventory turnover
calculate 2018 and 2019
1. ROA 2.DE 3. Groos profit 4. Quick ratio. 5. Debt to equity ratio: 6. Inventory turnover. nogin Eligibler Net Income = Total Revene- Total Expense. Total Assets = Liabilities + Owner's Equity Gross protit margin = (sales - rest of guels sodel/sales. 1. ROA 2. ROE 4. Quick ratio. 5. Debt to equity ratio. 6. Inventay turnover. 3. Gross protit Margin...
calculate
ROA
ROE
gross profit margin
quick ratio
debt to equity ratio
inventory turnover
calculate 2018 and 2019
1. ROA 2.DE 3. Groos profit 4. Quick ratio. 5. Debt to equity ratio: 6. Inventory turnover. nogin Eligibler Net Income = Total Revene- Total Expense. Total Assets = Liabilities + Owner's Equity Gross protit margin = (sales - rest of guels sodel/sales. 1. ROA 2. ROE 4. Quick ratio. 5. Debt to equity ratio. 6. Inventay turnover. 3. Gross protit Margin...
12 Months Ended Consolidated Statements of Income - USD ($) shares in Millions, $ in Millions...
 12 Months Ended Consolidated Statements of Income - USD ($) shares in Millions, $ in Millions Jan. 31, Jan. 31, You Must Use Excel Formulas in Yellow Boxes 2018 2017 Revenues: Horizontal Horizontal Dollar Value Percent $495,761 $481,317 Net sales Membership and other income 4,582 4,556 Total revenues 500,343 485,873 Costs and expenses: Cost of sales Gross Profit Operating, selling, general and 373,396 361,256 126,947 124,617 106,510 101,853 administrative expenses 20,437 22,764 Operating income Interest: Debt Capital lease and financing...
12 Months Ended Consolidated Statements of Income - USD ($) shares in Millions, $ in Millions...
 12 Months Ended Consolidated Statements of Income - USD ($) shares in Millions, $ in Millions Jan. 31, 2018 Jan. 31, 2017 $495,761 4,582 500,343 0 0 $481,317 4 ,556 0 485,873 373,396 106,510 0 o 361,256 101,853 20,437 22,764 Revenues: Net sales Membership and other income Total revenues Costs and expenses: Cost of sales Operating, selling, general and administrative expenses 0 Operating income 1 Interest: 2 Debt 3 Capital lease and financing obligations 4 Interest income 5 Interest, net...
12 Months Ended Consolidated Statements of Income - USD ($) shares in Millions, $ in Millions...
 12 Months Ended Consolidated Statements of Income - USD ($) shares in Millions, $ in Millions Jan. 31, 2018 Jan. 31, 2017 $ 495,761 4,582 500,343 0 $ 481,317 0 4,556 0 485,873 373,396 106,510 0 0 361,256 101,853 20,437 o 22,764 3Revenues: Net sales 5 Membership and other income 5 Total revenues Costs and expenses: Cost of sales Operating, selling, general and administrative expenses 10 Operating income 11 Interest: -2 Debt 3 Capital lease and financing obligations 4 Interest...
2019 2018 2017 Dollar Change Dollar Ch $ $ S S Millions Assets Curent Assets: Cash...
 2019 2018 2017 Dollar Change Dollar Ch $ $ S S Millions Assets Curent Assets: Cash and cash equivalents Accounts receivable, net Inventories Prepaid expenses and other Total current assets Property and equipment: Property and equipment Less: Accumulated Depreciation Property and Equipment, net Property under Capital lease and fianancing obligations, net: Property under Capital lease and financing obligations Less: Accumulated amortization Property under capital lease and financing obligations, net. 7,722 6,283 44,269 3,623 61,897 6,756 5,614 43,783 3,511 59,664 6,867...
I need some help with this problem. please show work. many thanks Walmart Ine. Consolidated Statements...
 I need some help with this problem. please show work.
many thanks
Walmart Ine. Consolidated Statements of Income Fiscal Years Euded January 31, 2018 2019 2017 (Amounts in mtllions, axrapt per share data) Reveaues: 495,761 $10.329 481317 Net sales 4.076 4,582 4,556 Membership and ober incomse 435,873 514.405 500,343 Total ieveues Costs and expeases: 361 256 Cost of sales 373,396 385.301 101.853 Operating, selling, geseral and administrative esspenses 107,147 106,510 22.764 Operating income 20.437 21.957 Interest: Debe 1,978 2.044 1.975...
I need some help with this problem. please show work.
many thanks
Walmart Ine. Consolidated Statements of Income Fiscal Years Euded January 31, 2018 2019 2017 (Amounts in mtllions, axrapt per share data) Reveaues: 495,761 $10.329 481317 Net sales 4.076 4,582 4,556 Membership and ober incomse 435,873 514.405 500,343 Total ieveues Costs and expeases: 361 256 Cost of sales 373,396 385.301 101.853 Operating, selling, geseral and administrative esspenses 107,147 106,510 22.764 Operating income 20.437 21.957 Interest: Debe 1,978 2.044 1.975...
using the data help solve rest CONSOLIDATED STATEMENTS OF INCOME Walmart amazon Dollars in millions Year...
 using the data help solve rest
CONSOLIDATED STATEMENTS OF INCOME Walmart amazon Dollars in millions Year ended January 31, 2019 Amount $514,405 385,301 129,104 Year ended December 31, 2018 Amount $232,887 139,156 93,731 107,147 81,310 21,957 12,421 Net revenue Cost of goods sold Gross Profit Operating expenses Selling, general & adm expenses Net operating income Other non-operating income (expenses) Interest income Interest expense Other income (loss) - net Income before income taxes Provision for taxes Net income 217 (2,346) (8,368)...
using the data help solve rest
CONSOLIDATED STATEMENTS OF INCOME Walmart amazon Dollars in millions Year ended January 31, 2019 Amount $514,405 385,301 129,104 Year ended December 31, 2018 Amount $232,887 139,156 93,731 107,147 81,310 21,957 12,421 Net revenue Cost of goods sold Gross Profit Operating expenses Selling, general & adm expenses Net operating income Other non-operating income (expenses) Interest income Interest expense Other income (loss) - net Income before income taxes Provision for taxes Net income 217 (2,346) (8,368)...
how can i get three years ratios . 2019 2018 2017 Dollar Change Dollar Ch $...
 how
can i get three years ratios .
2019 2018 2017 Dollar Change Dollar Ch $ $ S S Millions Assets Curent Assets: Cash and cash equivalents Accounts receivable, net Inventories Prepaid expenses and other Total current assets Property and equipment: Property and equipment Less: Accumulated Depreciation Property and Equipment, net Property under Capital lease and financing obligations, net: Property under Capital lease and financing obligations Less: Accumulated amortization Property under capital lease and financing obligations, net. 7,722 6,283 44,269...
how
can i get three years ratios .
2019 2018 2017 Dollar Change Dollar Ch $ $ S S Millions Assets Curent Assets: Cash and cash equivalents Accounts receivable, net Inventories Prepaid expenses and other Total current assets Property and equipment: Property and equipment Less: Accumulated Depreciation Property and Equipment, net Property under Capital lease and financing obligations, net: Property under Capital lease and financing obligations Less: Accumulated amortization Property under capital lease and financing obligations, net. 7,722 6,283 44,269...
12 Months Ended Consolidated Statements of Income - USD ($) shares in Millions, $ in Millions...
 12 Months Ended Consolidated Statements of Income - USD ($) shares in Millions, $ in Millions Jan. 31, 2018 Jan. 31, 2017 99.08% 0 $ 495,761 4,582 500,343 $ 481,317 4,556 485,873 99.06% 0.94% 0 373,396 106,510 0 o 361,256 101,853 20,437 22,764 3 Revenues: 4 Net sales 5 Membership and other income 6 Total revenues 7 Costs and expenses: 8 Cost of sales Operating, selling, general and administrative 9 expenses 10 Operating income 11 Interest: 12 Debt 13 Capital...
what is the times interest earned ratio for 2017 Consolidated Statement of Income PepsiCo, Inc. and...
 what is the times interest earned ratio for 2017
Consolidated Statement of Income PepsiCo, Inc. and Subsidiaries Fiscal years ended December 27, 2017, December 28, 2016 and December 29, 2015 (in millions except per share amounts) $ $ 2017 63,525 28,785 34,740 24,231 2016 62,799 $ 28,209 34,590 24,805 2015 63,056 28,731 34,325 24,613 1,359 8,353 (970) +5+) 10,509 (1,151) 244 9,602 4,694 59 Net Revenue Cost of sales Gross profit Selling, general and administrative expenses Venezuela impairment charges Operating...
what is the times interest earned ratio for 2017
Consolidated Statement of Income PepsiCo, Inc. and Subsidiaries Fiscal years ended December 27, 2017, December 28, 2016 and December 29, 2015 (in millions except per share amounts) $ $ 2017 63,525 28,785 34,740 24,231 2016 62,799 $ 28,209 34,590 24,805 2015 63,056 28,731 34,325 24,613 1,359 8,353 (970) +5+) 10,509 (1,151) 244 9,602 4,694 59 Net Revenue Cost of sales Gross profit Selling, general and administrative expenses Venezuela impairment charges Operating...
 calculate
ROA
ROE
gross profit margin
quick ratio
debt to equity ratio
inventory turnover
calculate 2018 and 2019
1. ROA 2.DE 3. Groos profit 4. Quick ratio. 5. Debt to equity ratio: 6. Inventory turnover. nogin Eligibler Net Income = Total Revene- Total Expense. Total Assets = Liabilities + Owner's Equity Gross protit margin = (sales - rest of guels sodel/sales. 1. ROA 2. ROE 4. Quick ratio. 5. Debt to equity ratio. 6. Inventay turnover. 3. Gross protit Margin...
calculate
ROA
ROE
gross profit margin
quick ratio
debt to equity ratio
inventory turnover
calculate 2018 and 2019
1. ROA 2.DE 3. Groos profit 4. Quick ratio. 5. Debt to equity ratio: 6. Inventory turnover. nogin Eligibler Net Income = Total Revene- Total Expense. Total Assets = Liabilities + Owner's Equity Gross protit margin = (sales - rest of guels sodel/sales. 1. ROA 2. ROE 4. Quick ratio. 5. Debt to equity ratio. 6. Inventay turnover. 3. Gross protit Margin...
 12 Months Ended Consolidated Statements of Income - USD ($) shares in Millions, $ in Millions Jan. 31, Jan. 31, You Must Use Excel Formulas in Yellow Boxes 2018 2017 Revenues: Horizontal Horizontal Dollar Value Percent $495,761 $481,317 Net sales Membership and other income 4,582 4,556 Total revenues 500,343 485,873 Costs and expenses: Cost of sales Gross Profit Operating, selling, general and 373,396 361,256 126,947 124,617 106,510 101,853 administrative expenses 20,437 22,764 Operating income Interest: Debt Capital lease and financing...
 12 Months Ended Consolidated Statements of Income - USD ($) shares in Millions, $ in Millions Jan. 31, 2018 Jan. 31, 2017 $495,761 4,582 500,343 0 0 $481,317 4 ,556 0 485,873 373,396 106,510 0 o 361,256 101,853 20,437 22,764 Revenues: Net sales Membership and other income Total revenues Costs and expenses: Cost of sales Operating, selling, general and administrative expenses 0 Operating income 1 Interest: 2 Debt 3 Capital lease and financing obligations 4 Interest income 5 Interest, net...
 12 Months Ended Consolidated Statements of Income - USD ($) shares in Millions, $ in Millions Jan. 31, 2018 Jan. 31, 2017 $ 495,761 4,582 500,343 0 $ 481,317 0 4,556 0 485,873 373,396 106,510 0 0 361,256 101,853 20,437 o 22,764 3Revenues: Net sales 5 Membership and other income 5 Total revenues Costs and expenses: Cost of sales Operating, selling, general and administrative expenses 10 Operating income 11 Interest: -2 Debt 3 Capital lease and financing obligations 4 Interest...
 2019 2018 2017 Dollar Change Dollar Ch $ $ S S Millions Assets Curent Assets: Cash and cash equivalents Accounts receivable, net Inventories Prepaid expenses and other Total current assets Property and equipment: Property and equipment Less: Accumulated Depreciation Property and Equipment, net Property under Capital lease and fianancing obligations, net: Property under Capital lease and financing obligations Less: Accumulated amortization Property under capital lease and financing obligations, net. 7,722 6,283 44,269 3,623 61,897 6,756 5,614 43,783 3,511 59,664 6,867...
 I need some help with this problem. please show work.
many thanks
Walmart Ine. Consolidated Statements of Income Fiscal Years Euded January 31, 2018 2019 2017 (Amounts in mtllions, axrapt per share data) Reveaues: 495,761 $10.329 481317 Net sales 4.076 4,582 4,556 Membership and ober incomse 435,873 514.405 500,343 Total ieveues Costs and expeases: 361 256 Cost of sales 373,396 385.301 101.853 Operating, selling, geseral and administrative esspenses 107,147 106,510 22.764 Operating income 20.437 21.957 Interest: Debe 1,978 2.044 1.975...
I need some help with this problem. please show work.
many thanks
Walmart Ine. Consolidated Statements of Income Fiscal Years Euded January 31, 2018 2019 2017 (Amounts in mtllions, axrapt per share data) Reveaues: 495,761 $10.329 481317 Net sales 4.076 4,582 4,556 Membership and ober incomse 435,873 514.405 500,343 Total ieveues Costs and expeases: 361 256 Cost of sales 373,396 385.301 101.853 Operating, selling, geseral and administrative esspenses 107,147 106,510 22.764 Operating income 20.437 21.957 Interest: Debe 1,978 2.044 1.975...
 using the data help solve rest
CONSOLIDATED STATEMENTS OF INCOME Walmart amazon Dollars in millions Year ended January 31, 2019 Amount $514,405 385,301 129,104 Year ended December 31, 2018 Amount $232,887 139,156 93,731 107,147 81,310 21,957 12,421 Net revenue Cost of goods sold Gross Profit Operating expenses Selling, general & adm expenses Net operating income Other non-operating income (expenses) Interest income Interest expense Other income (loss) - net Income before income taxes Provision for taxes Net income 217 (2,346) (8,368)...
using the data help solve rest
CONSOLIDATED STATEMENTS OF INCOME Walmart amazon Dollars in millions Year ended January 31, 2019 Amount $514,405 385,301 129,104 Year ended December 31, 2018 Amount $232,887 139,156 93,731 107,147 81,310 21,957 12,421 Net revenue Cost of goods sold Gross Profit Operating expenses Selling, general & adm expenses Net operating income Other non-operating income (expenses) Interest income Interest expense Other income (loss) - net Income before income taxes Provision for taxes Net income 217 (2,346) (8,368)...
 how
can i get three years ratios .
2019 2018 2017 Dollar Change Dollar Ch $ $ S S Millions Assets Curent Assets: Cash and cash equivalents Accounts receivable, net Inventories Prepaid expenses and other Total current assets Property and equipment: Property and equipment Less: Accumulated Depreciation Property and Equipment, net Property under Capital lease and financing obligations, net: Property under Capital lease and financing obligations Less: Accumulated amortization Property under capital lease and financing obligations, net. 7,722 6,283 44,269...
how
can i get three years ratios .
2019 2018 2017 Dollar Change Dollar Ch $ $ S S Millions Assets Curent Assets: Cash and cash equivalents Accounts receivable, net Inventories Prepaid expenses and other Total current assets Property and equipment: Property and equipment Less: Accumulated Depreciation Property and Equipment, net Property under Capital lease and financing obligations, net: Property under Capital lease and financing obligations Less: Accumulated amortization Property under capital lease and financing obligations, net. 7,722 6,283 44,269...
 12 Months Ended Consolidated Statements of Income - USD ($) shares in Millions, $ in Millions Jan. 31, 2018 Jan. 31, 2017 99.08% 0 $ 495,761 4,582 500,343 $ 481,317 4,556 485,873 99.06% 0.94% 0 373,396 106,510 0 o 361,256 101,853 20,437 22,764 3 Revenues: 4 Net sales 5 Membership and other income 6 Total revenues 7 Costs and expenses: 8 Cost of sales Operating, selling, general and administrative 9 expenses 10 Operating income 11 Interest: 12 Debt 13 Capital...
 what is the times interest earned ratio for 2017
Consolidated Statement of Income PepsiCo, Inc. and Subsidiaries Fiscal years ended December 27, 2017, December 28, 2016 and December 29, 2015 (in millions except per share amounts) $ $ 2017 63,525 28,785 34,740 24,231 2016 62,799 $ 28,209 34,590 24,805 2015 63,056 28,731 34,325 24,613 1,359 8,353 (970) +5+) 10,509 (1,151) 244 9,602 4,694 59 Net Revenue Cost of sales Gross profit Selling, general and administrative expenses Venezuela impairment charges Operating...
what is the times interest earned ratio for 2017
Consolidated Statement of Income PepsiCo, Inc. and Subsidiaries Fiscal years ended December 27, 2017, December 28, 2016 and December 29, 2015 (in millions except per share amounts) $ $ 2017 63,525 28,785 34,740 24,231 2016 62,799 $ 28,209 34,590 24,805 2015 63,056 28,731 34,325 24,613 1,359 8,353 (970) +5+) 10,509 (1,151) 244 9,602 4,694 59 Net Revenue Cost of sales Gross profit Selling, general and administrative expenses Venezuela impairment charges Operating...
Most questions answered within 3 hours.
-
Where is the error in this code sequence?
String s1 = "Hello";
String s2 = "ello";...
asked 11 months ago -
Financial data for Joel de Paris, Inc., for last year
follow:
Joel de Paris, Inc.
Balance...
asked 11 months ago -
Consider this reaction:
Al2(SO4)3 (aq)+ BaCl3
(aq) Al2Cl6 (aq)- +
3BaSO4(s) . What is the...
asked 11 months ago -
Suppose that Savneet is considering increasing her
recent random sample from 20 car rentals to 40...
asked 11 months ago -
Trucks arrive at an unloading terminal at an average rate of 120
per hour.
Trucks arrive...
asked 11 months ago -
Why are methanol and ethanol completely soluble in water while
octanol is not very little soluble....
asked 11 months ago -
A facilities manager at a university reads in a research report
that the mean amount of...
asked 11 months ago -
When the CuSO4 is rehydrated by adding water to the anhydrous
compound, is this an endothermic...
asked 11 months ago -
A ray of sunlight is passing from diamond into crown glass; the
angle of incidence is...
asked 11 months ago -
A block of mass 0.249 kg is placed on top of a light, vertical
spring of...
asked 11 months ago -
how do the kidneys compensate in the presences of acidosis
a) trigger hyperventilate
b) reserve acid...
asked 11 months ago -
Question 501 pts
The rental rate of capital to the firm increases. Which of the
following...
asked 11 months ago