
Homework Answers
Add Answer to:
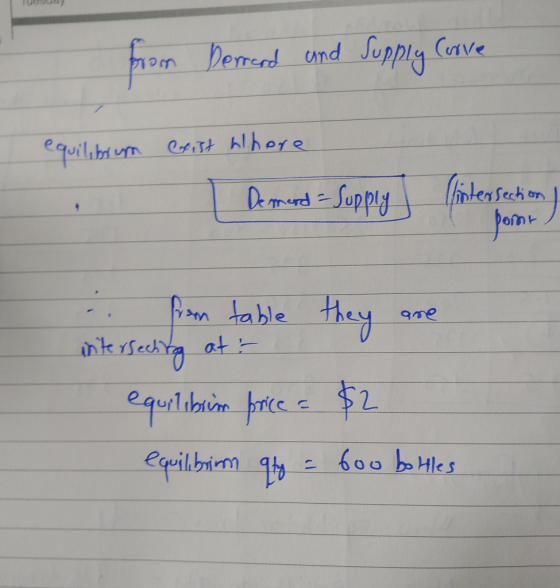
The graph below represents the market for bottled water. a. What is the equilibrium price? $...
The graph below represents the market for bottled water. b. If a price floor Is Imposed...
 The graph below represents the market for bottled water. b. If a price floor Is Imposed at $1.50 per bottle, how large will the surplus in the market be? bottles Do NOT press Enter after typing the answer in each cell. Use Tab or take the cursor to the next cell. Price (dollars ܪܵܝܼ ܝܼ ܝܼ ܊ ܝܼ ܝܼ ܝܼ ܝܼܐ - ; Submit 200 400 600 800 1,000 1,200 Quantity (bottles)
The following table shows the supply and demand schedules for computers in Sweden and Norway. Price...
The following table shows the supply and demand schedules for computers in Sweden and Norway. Price Sweden Price Norway (Dollars) Quantity Supplied Quantity Demanded (Dollars) Quantity Supplied Quantity Demanded 0 0 1,200 0 1,800 5 200 1,000 5 1,600 10 400 800 10 1,400 15 600 600 15 0 1,200 20 800 400 20 200 1,000 25 1,000 200 25 400 800 30 1,200 0 30 600 600 35 1,400 35 800 400 40 1,600 40 1,000 200 45 1,800...
Suppose the quantity demanded increases by 150 tons at every price. Consider the market for strawberries...
 Suppose the quantity demanded increases by 150 tons at every price. Consider the market for strawberries represented in the schedule below. What is the new equilibrium price? $ What is the new equilibrium quantity? tons 275 Do NOT press Enter after typing the answer in each cell. Use Tab or take the cursor to the next cell. Price Quantity Supplied Quantity Demanded ($/b.) (tons) (tons) $3.00 125 2.50 250 175 2.00 225 225 1.50 200 275 1.00 175 325 0.50...
#1. The following table illustrates the demand and supply schedules for calculators in Sweden and Norway...
 #1. The following table illustrates the demand and supply schedules for calculators in Sweden and Norway (measured in dollars). Price Sweden Norway Quantity Supplied Quantity Demanded | Quantity Supplied Quantity Demanded 0 1,200 1,800 200 1,000 - 1,600 400 800 1.400 600 600 1,200 800 400 200 1,000 1,000 200 400 800 1,200 600 600 1,400 800 400 1,600 1,000 200 1,800 1,200 a. In a similar graph to Figure 3.6(a) - page 106- of the Carbaugh text, draw the...
12. Suppose Market A (left) represents the market for corn in the short run and Market...
 12. Suppose Market A (left) represents the market for corn in the short run and Market B represents the market for corn (right) in the long run. Large scale negative publicity about the health effects of high fructose corn syrup would have a larger effect on the price of corn in which market? Assume that the effect of negative publicity is the same in both the short and the long run. X 50 50 40 40 MC 30 30 20...
3. Market equilibrium The following table shows the annual demand and supply in the market for...
 3. Market equilibrium The following table shows the annual demand and supply in the market for shorts in Detroit. Price Quantity Demanded (Pairs of shorts) Quantity Supplied (Pairs of shorts) (Dollars per pair of shorts) 6 1,100 200 12 800 500 18 400 700 24 200 900 30 100 1,000 On the following graph, plot the demand for shorts using the blue point (circle symbol). Next, plot the supply of shorts using the orange point (square symbol). Finally, use the...
9. Shifts in supply or demand II The following graph shows the market for...
 1)9. Shifts in supply or demand IIThe following graph shows the market for cakes in Miami, where there are over 1,000 bakeries at any given moment. Suppose the price of flour, a major ingredient in cakes, suddenly increases.Show the effect of this change on the market for cakes by shifting one or both of the curves on the following graph, holding all else constant.2)10. Market equilibriumThe following table shows the annual demand and supply in the market for shoes in...
The following graph shows the daily market for wine when a tax on sellers is set...
 The following graph shows the daily market for wine when a tax on sellers is set at $0 per bottle. Suppose the government institutes a tax of $40.60 per bottle, to be paid by the seller. (Hint: To see the impact of the tax, enter the value of the tax in the Tax on Sellers field and move the green line to the after-tax equilibrium by adjusting the value in the Quantity field. Then enter zero in the Tax on...
#1. The following table illustrates the demand and supply schedules for calculators in Sweden and Norway...
 #1. The following table illustrates the demand and supply schedules for calculators in Sweden and Norway (measured in dollars). Price $0 O 1,200 5 10 400 15 Sweden Norway Quantity Supplied Quantity Demanded Quantity Supplied Quantity Demanded 1,800 200 1,000 1,600 800 1,400 600 6000 1,200 800 200 1,000 1,000 200 400 800 1,200 600 L 600 1,400 - 800 400 1,600 1,000 200 1,800 1,200 20 400 25 30 35 40 45 We were unable to transcribe this image
In the long run, some firms will respond by until On the graph below, shift the...
 In the long run, some firms will respond by until On the graph below, shift the demand curve, the supply curve, or both on the following diagram to illustrate both the short-run effects of the PHAC'S report and the new long-run equilibrium after firms and consumers finish adjusting to the news. Supply Demand Supply PRICE (Dollars per kilogram) Demand 0 100 900 1000 200 300 400 500 600 700 800 QUANTITY (Milions of kilograms) The new equilibrium price and quantity...
 The graph below represents the market for bottled water. b. If a price floor Is Imposed at $1.50 per bottle, how large will the surplus in the market be? bottles Do NOT press Enter after typing the answer in each cell. Use Tab or take the cursor to the next cell. Price (dollars ܪܵܝܼ ܝܼ ܝܼ ܊ ܝܼ ܝܼ ܝܼ ܝܼܐ - ; Submit 200 400 600 800 1,000 1,200 Quantity (bottles)
 Suppose the quantity demanded increases by 150 tons at every price. Consider the market for strawberries represented in the schedule below. What is the new equilibrium price? $ What is the new equilibrium quantity? tons 275 Do NOT press Enter after typing the answer in each cell. Use Tab or take the cursor to the next cell. Price Quantity Supplied Quantity Demanded ($/b.) (tons) (tons) $3.00 125 2.50 250 175 2.00 225 225 1.50 200 275 1.00 175 325 0.50...
 #1. The following table illustrates the demand and supply schedules for calculators in Sweden and Norway (measured in dollars). Price Sweden Norway Quantity Supplied Quantity Demanded | Quantity Supplied Quantity Demanded 0 1,200 1,800 200 1,000 - 1,600 400 800 1.400 600 600 1,200 800 400 200 1,000 1,000 200 400 800 1,200 600 600 1,400 800 400 1,600 1,000 200 1,800 1,200 a. In a similar graph to Figure 3.6(a) - page 106- of the Carbaugh text, draw the...
 12. Suppose Market A (left) represents the market for corn in the short run and Market B represents the market for corn (right) in the long run. Large scale negative publicity about the health effects of high fructose corn syrup would have a larger effect on the price of corn in which market? Assume that the effect of negative publicity is the same in both the short and the long run. X 50 50 40 40 MC 30 30 20...
 3. Market equilibrium The following table shows the annual demand and supply in the market for shorts in Detroit. Price Quantity Demanded (Pairs of shorts) Quantity Supplied (Pairs of shorts) (Dollars per pair of shorts) 6 1,100 200 12 800 500 18 400 700 24 200 900 30 100 1,000 On the following graph, plot the demand for shorts using the blue point (circle symbol). Next, plot the supply of shorts using the orange point (square symbol). Finally, use the...
 The following graph shows the daily market for wine when a tax on sellers is set at $0 per bottle. Suppose the government institutes a tax of $40.60 per bottle, to be paid by the seller. (Hint: To see the impact of the tax, enter the value of the tax in the Tax on Sellers field and move the green line to the after-tax equilibrium by adjusting the value in the Quantity field. Then enter zero in the Tax on...
 #1. The following table illustrates the demand and supply schedules for calculators in Sweden and Norway (measured in dollars). Price $0 O 1,200 5 10 400 15 Sweden Norway Quantity Supplied Quantity Demanded Quantity Supplied Quantity Demanded 1,800 200 1,000 1,600 800 1,400 600 6000 1,200 800 200 1,000 1,000 200 400 800 1,200 600 L 600 1,400 - 800 400 1,600 1,000 200 1,800 1,200 20 400 25 30 35 40 45 We were unable to transcribe this image
 In the long run, some firms will respond by until On the graph below, shift the demand curve, the supply curve, or both on the following diagram to illustrate both the short-run effects of the PHAC'S report and the new long-run equilibrium after firms and consumers finish adjusting to the news. Supply Demand Supply PRICE (Dollars per kilogram) Demand 0 100 900 1000 200 300 400 500 600 700 800 QUANTITY (Milions of kilograms) The new equilibrium price and quantity...
Most questions answered within 3 hours.
-
Where is the error in this code sequence?
String s1 = "Hello";
String s2 = "ello";...
asked 10 months ago -
Financial data for Joel de Paris, Inc., for last year
follow:
Joel de Paris, Inc.
Balance...
asked 10 months ago -
Consider this reaction:
Al2(SO4)3 (aq)+ BaCl3
(aq) Al2Cl6 (aq)- +
3BaSO4(s) . What is the...
asked 10 months ago -
Suppose that Savneet is considering increasing her
recent random sample from 20 car rentals to 40...
asked 10 months ago -
Trucks arrive at an unloading terminal at an average rate of 120
per hour.
Trucks arrive...
asked 10 months ago -
Why are methanol and ethanol completely soluble in water while
octanol is not very little soluble....
asked 10 months ago -
A facilities manager at a university reads in a research report
that the mean amount of...
asked 10 months ago -
When the CuSO4 is rehydrated by adding water to the anhydrous
compound, is this an endothermic...
asked 10 months ago -
A ray of sunlight is passing from diamond into crown glass; the
angle of incidence is...
asked 10 months ago -
A block of mass 0.249 kg is placed on top of a light, vertical
spring of...
asked 10 months ago -
how do the kidneys compensate in the presences of acidosis
a) trigger hyperventilate
b) reserve acid...
asked 10 months ago -
Question 501 pts
The rental rate of capital to the firm increases. Which of the
following...
asked 10 months ago